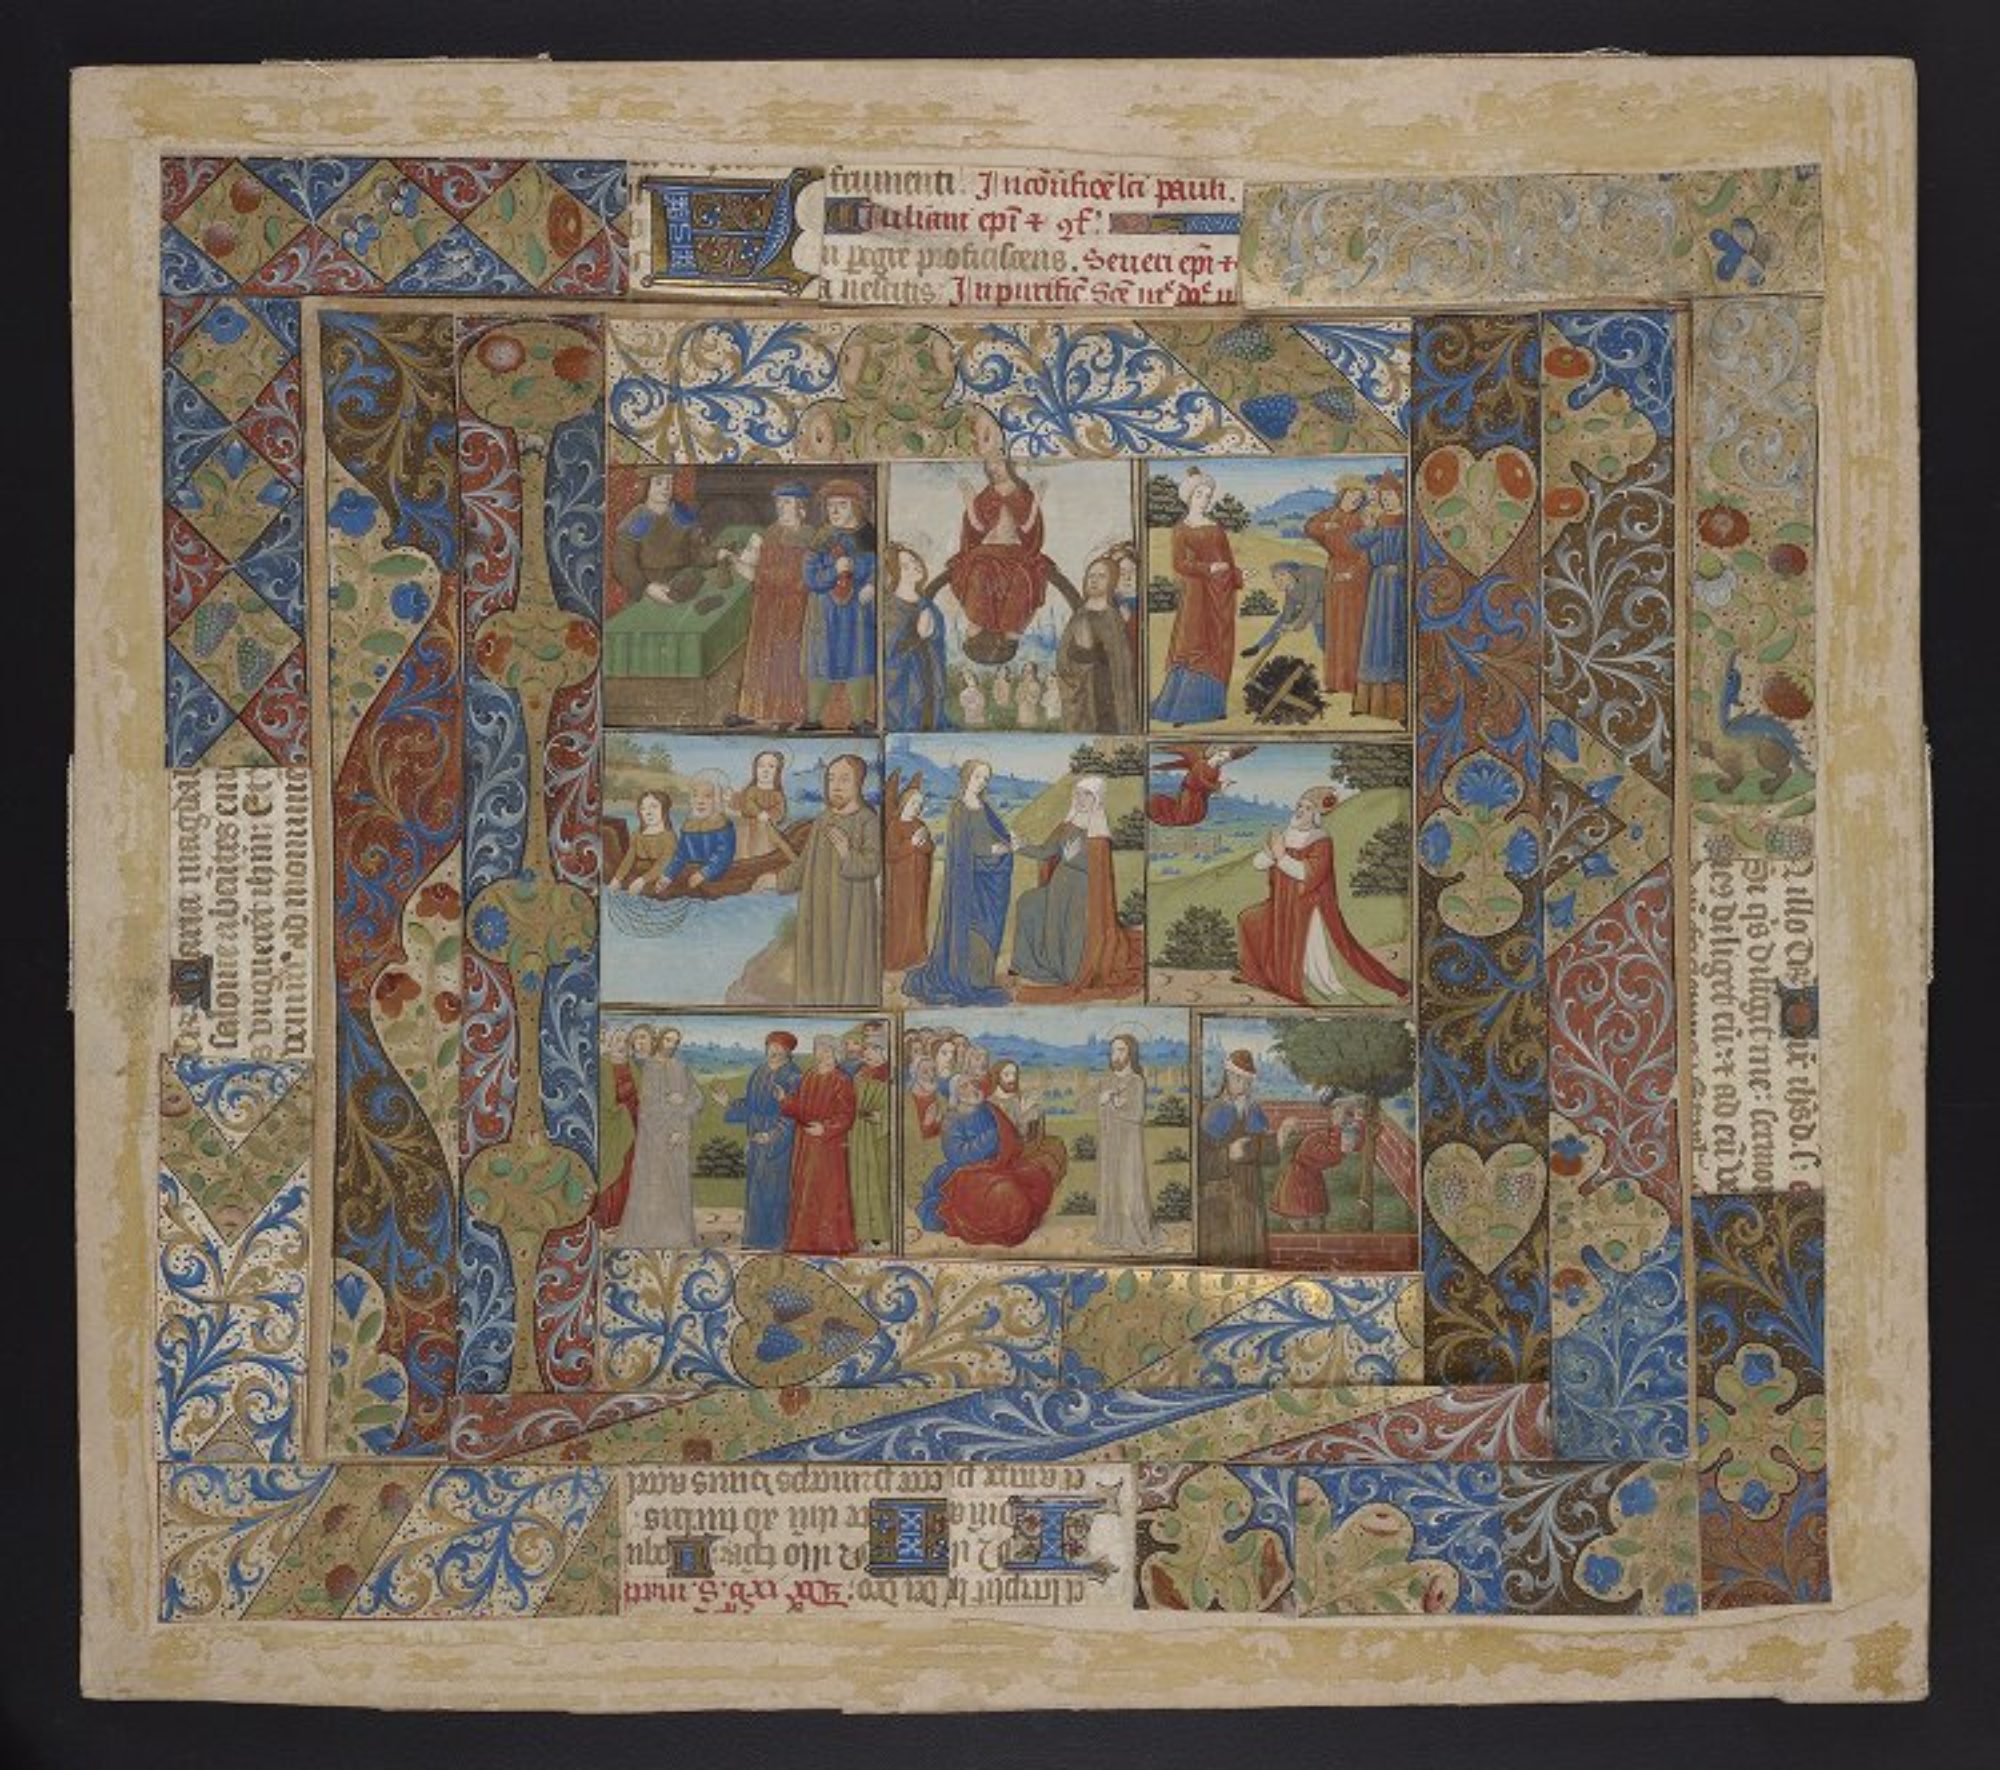
Presented in the session Materiality of Manuscripts III: The Codex at the International Medieval Congress, Leeds, UK July 5, 2022
Good morning, good afternoon. Thank you to Katarzyna and Kıvılcım for organizing these sessions on Materiality of Manuscripts for IMC 2022. I’m Dot Porter and I’m going to talk about modeling the historical manuscript theory and practice.
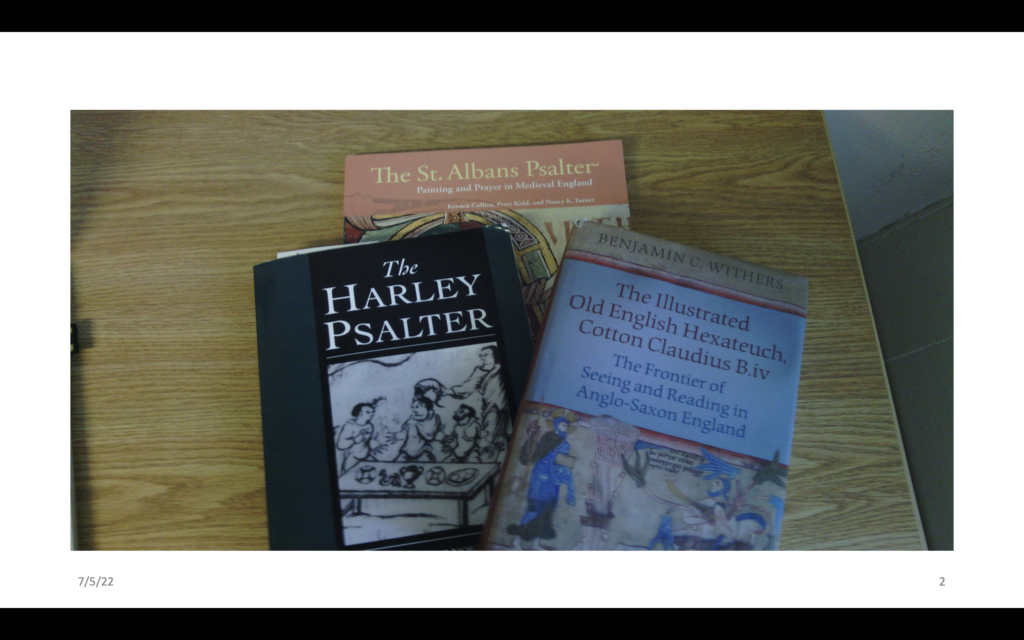
As a curator, I’m interested in making all of our manuscripts available at the same level. Oftentimes, descriptive information about manuscripts, particularly diagrams and charts, are in books that are focused on individual manuscripts. Manuscript catalogs don’t tend to include structural visualizations except perhaps when something highly unusual needs to be described. I’ve long found that detailed visualizations the structure of manuscripts are helpful to me, and as a curator, I’m interested in seeing if we can provide them not only for high status items, but for whole collections.
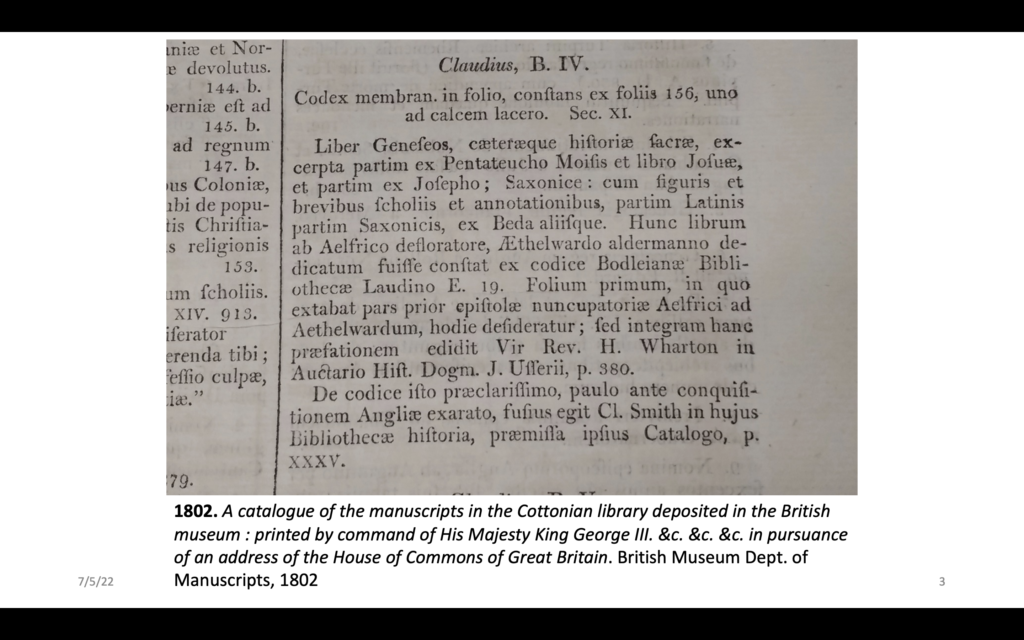
Catalogs – documents that describe many manuscripts at about the same level – have not always treated structural description in a serious way. This is a description of a manuscript from the 1802 catalog of the manuscripts in the Cottonian library in the British Museum. The manuscript is Cotton Claudius b. iv, which is a very beautiful and complex 11th century illustrated manuscript.
The description in the 1802 catalog is only three paragraphs, quite short, and the physical description is the first couple of lines. What this says is, it’s a codex – multiple quires – it’s made of parchment, it has 156 folios, and there’s a leaf that has been mutilated. This is the extent of the physical description of the manuscript in 1802.
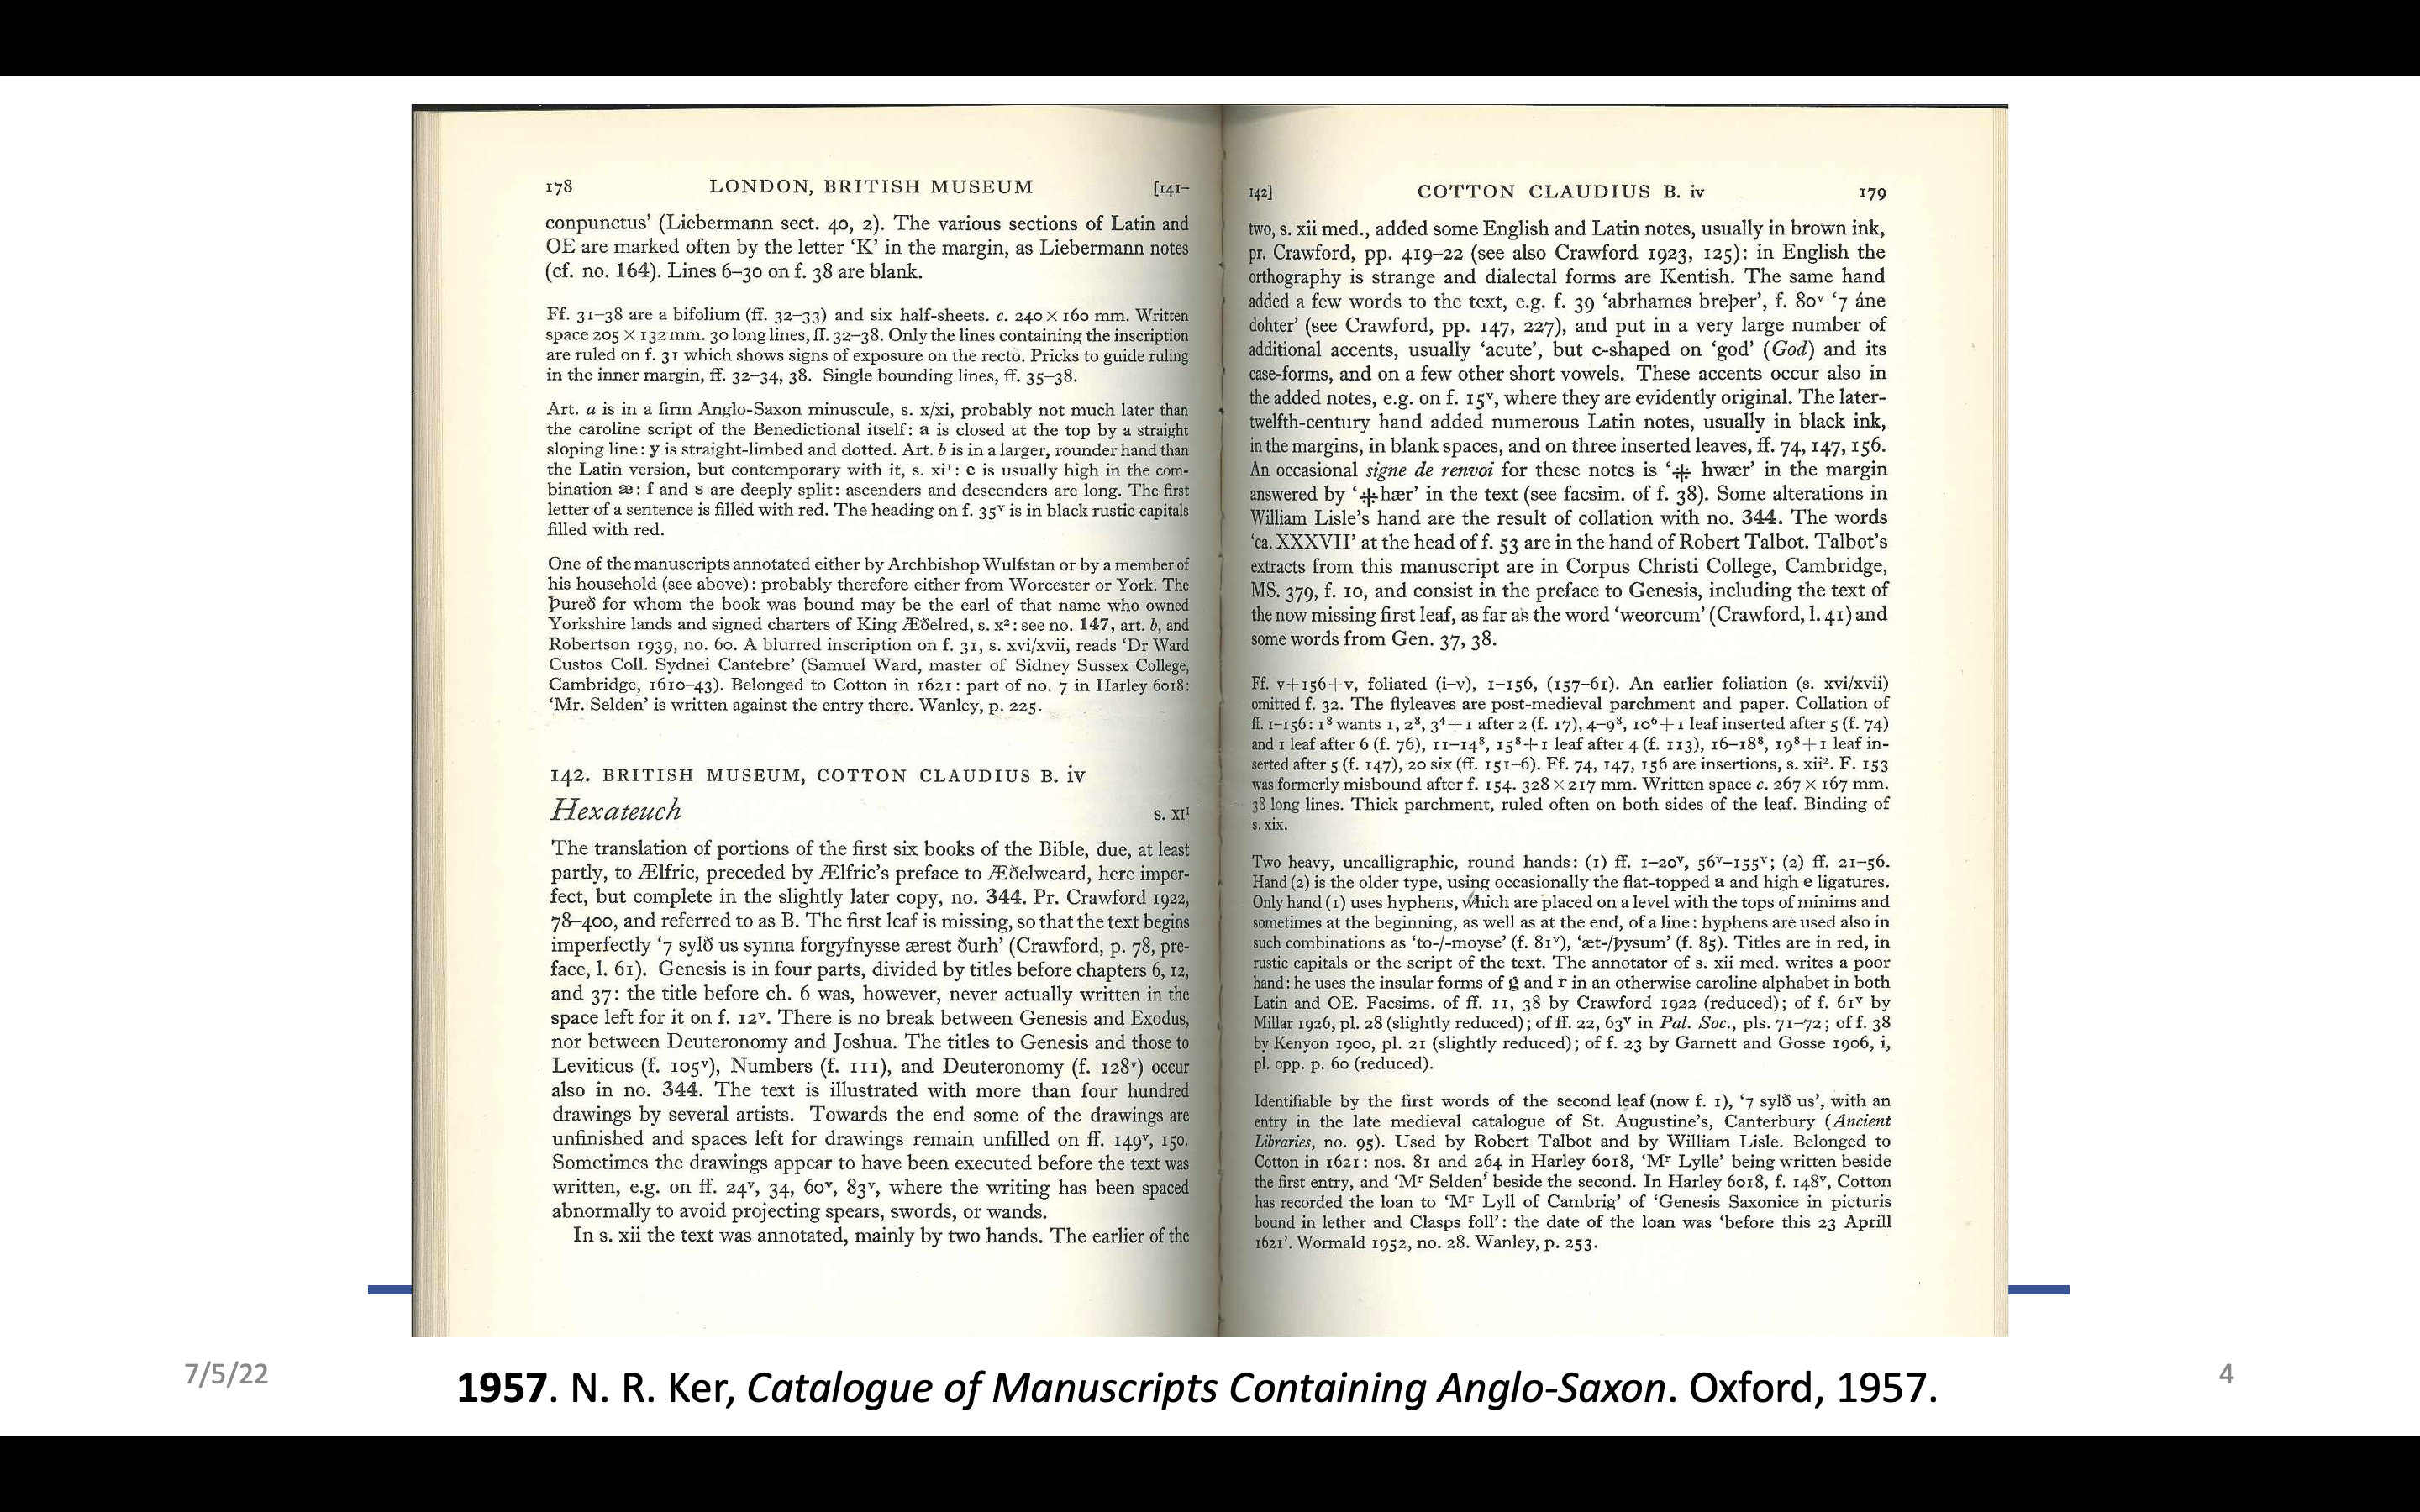
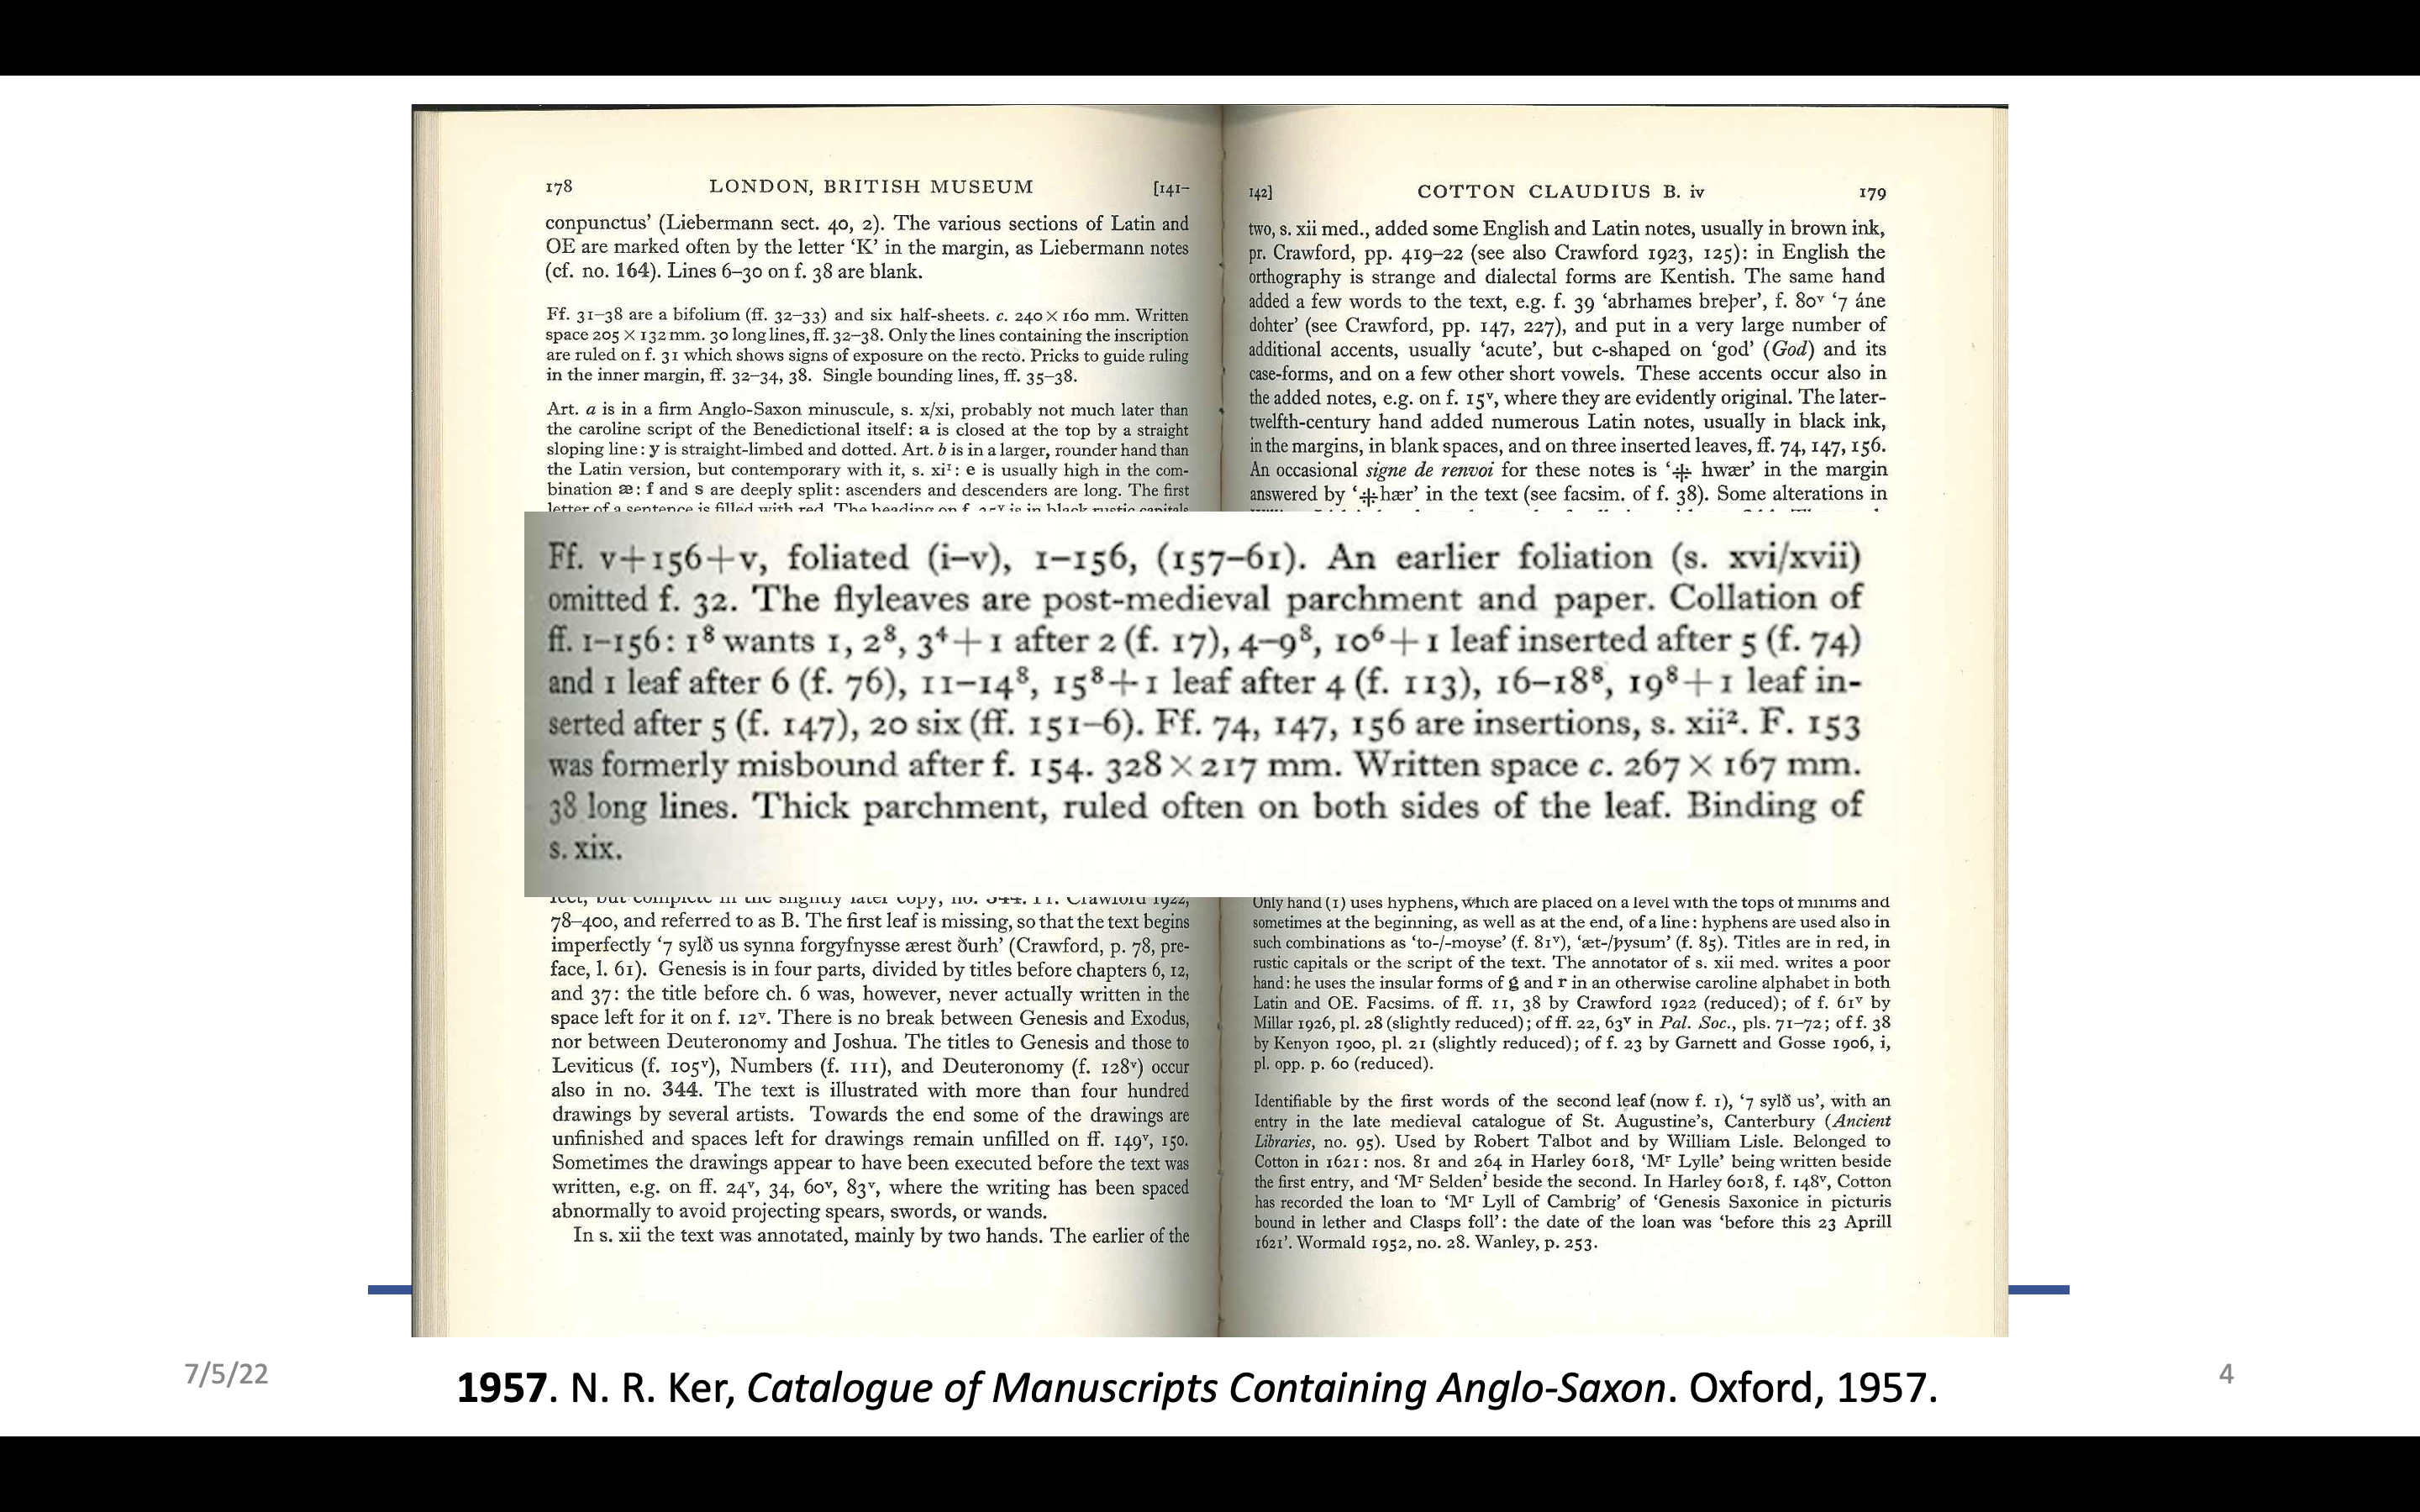
Jumping ahead, to 1957 we have this same manuscript described in Ker’s catalog of manuscripts containing Anglo Saxon. The entire description is much longer. The physical description, likewise, and we see that a major part of the physical description is a collation formula. You all know what a collation formula is, it’s the standard way of describing then physical structure of books in a sort of systematic way. I say sort of systematic because there’s not actually a standard for manuscript collation formulas, unlike printed books where there is a well-accepted standard. Although there’s not a standard way of writing formulas they all work in basically the same way – a formula will describe how many quires there are, how many leaves each quire has, perhaps a little bit about how they relate to each other. Frequently, there will also be additional information about structure in a narrative, describing leaves that are missing or weird things that are happening.
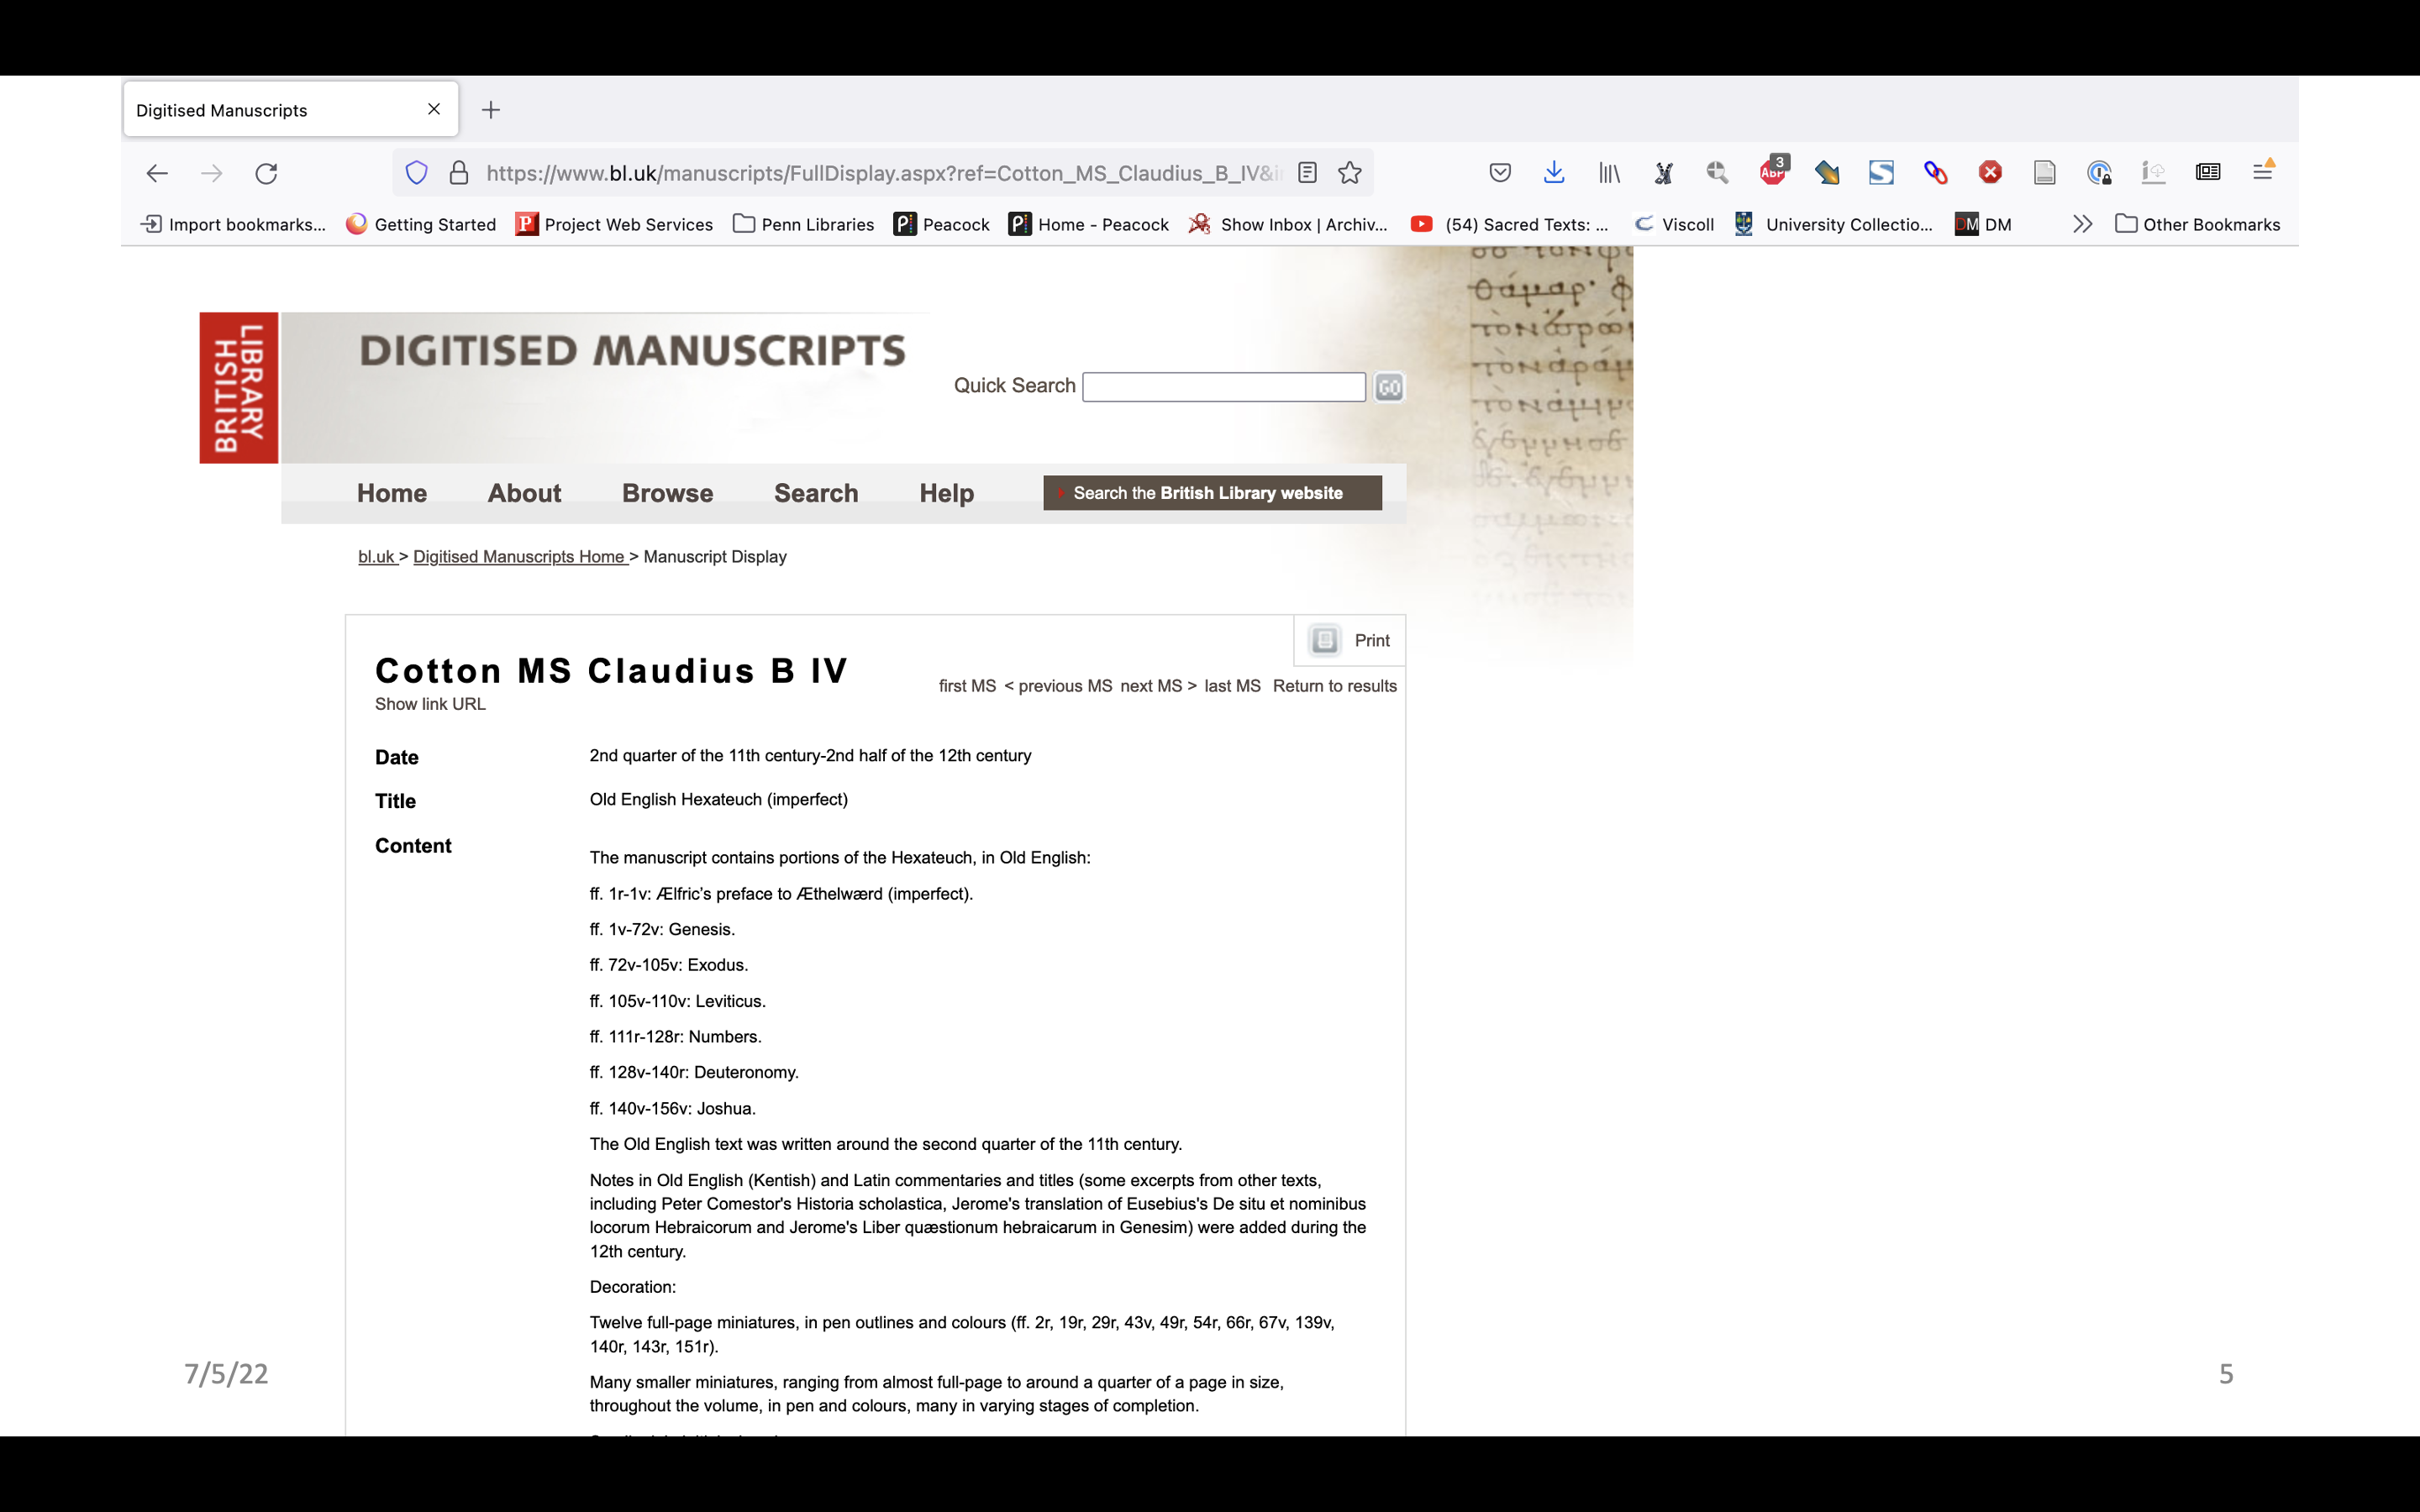
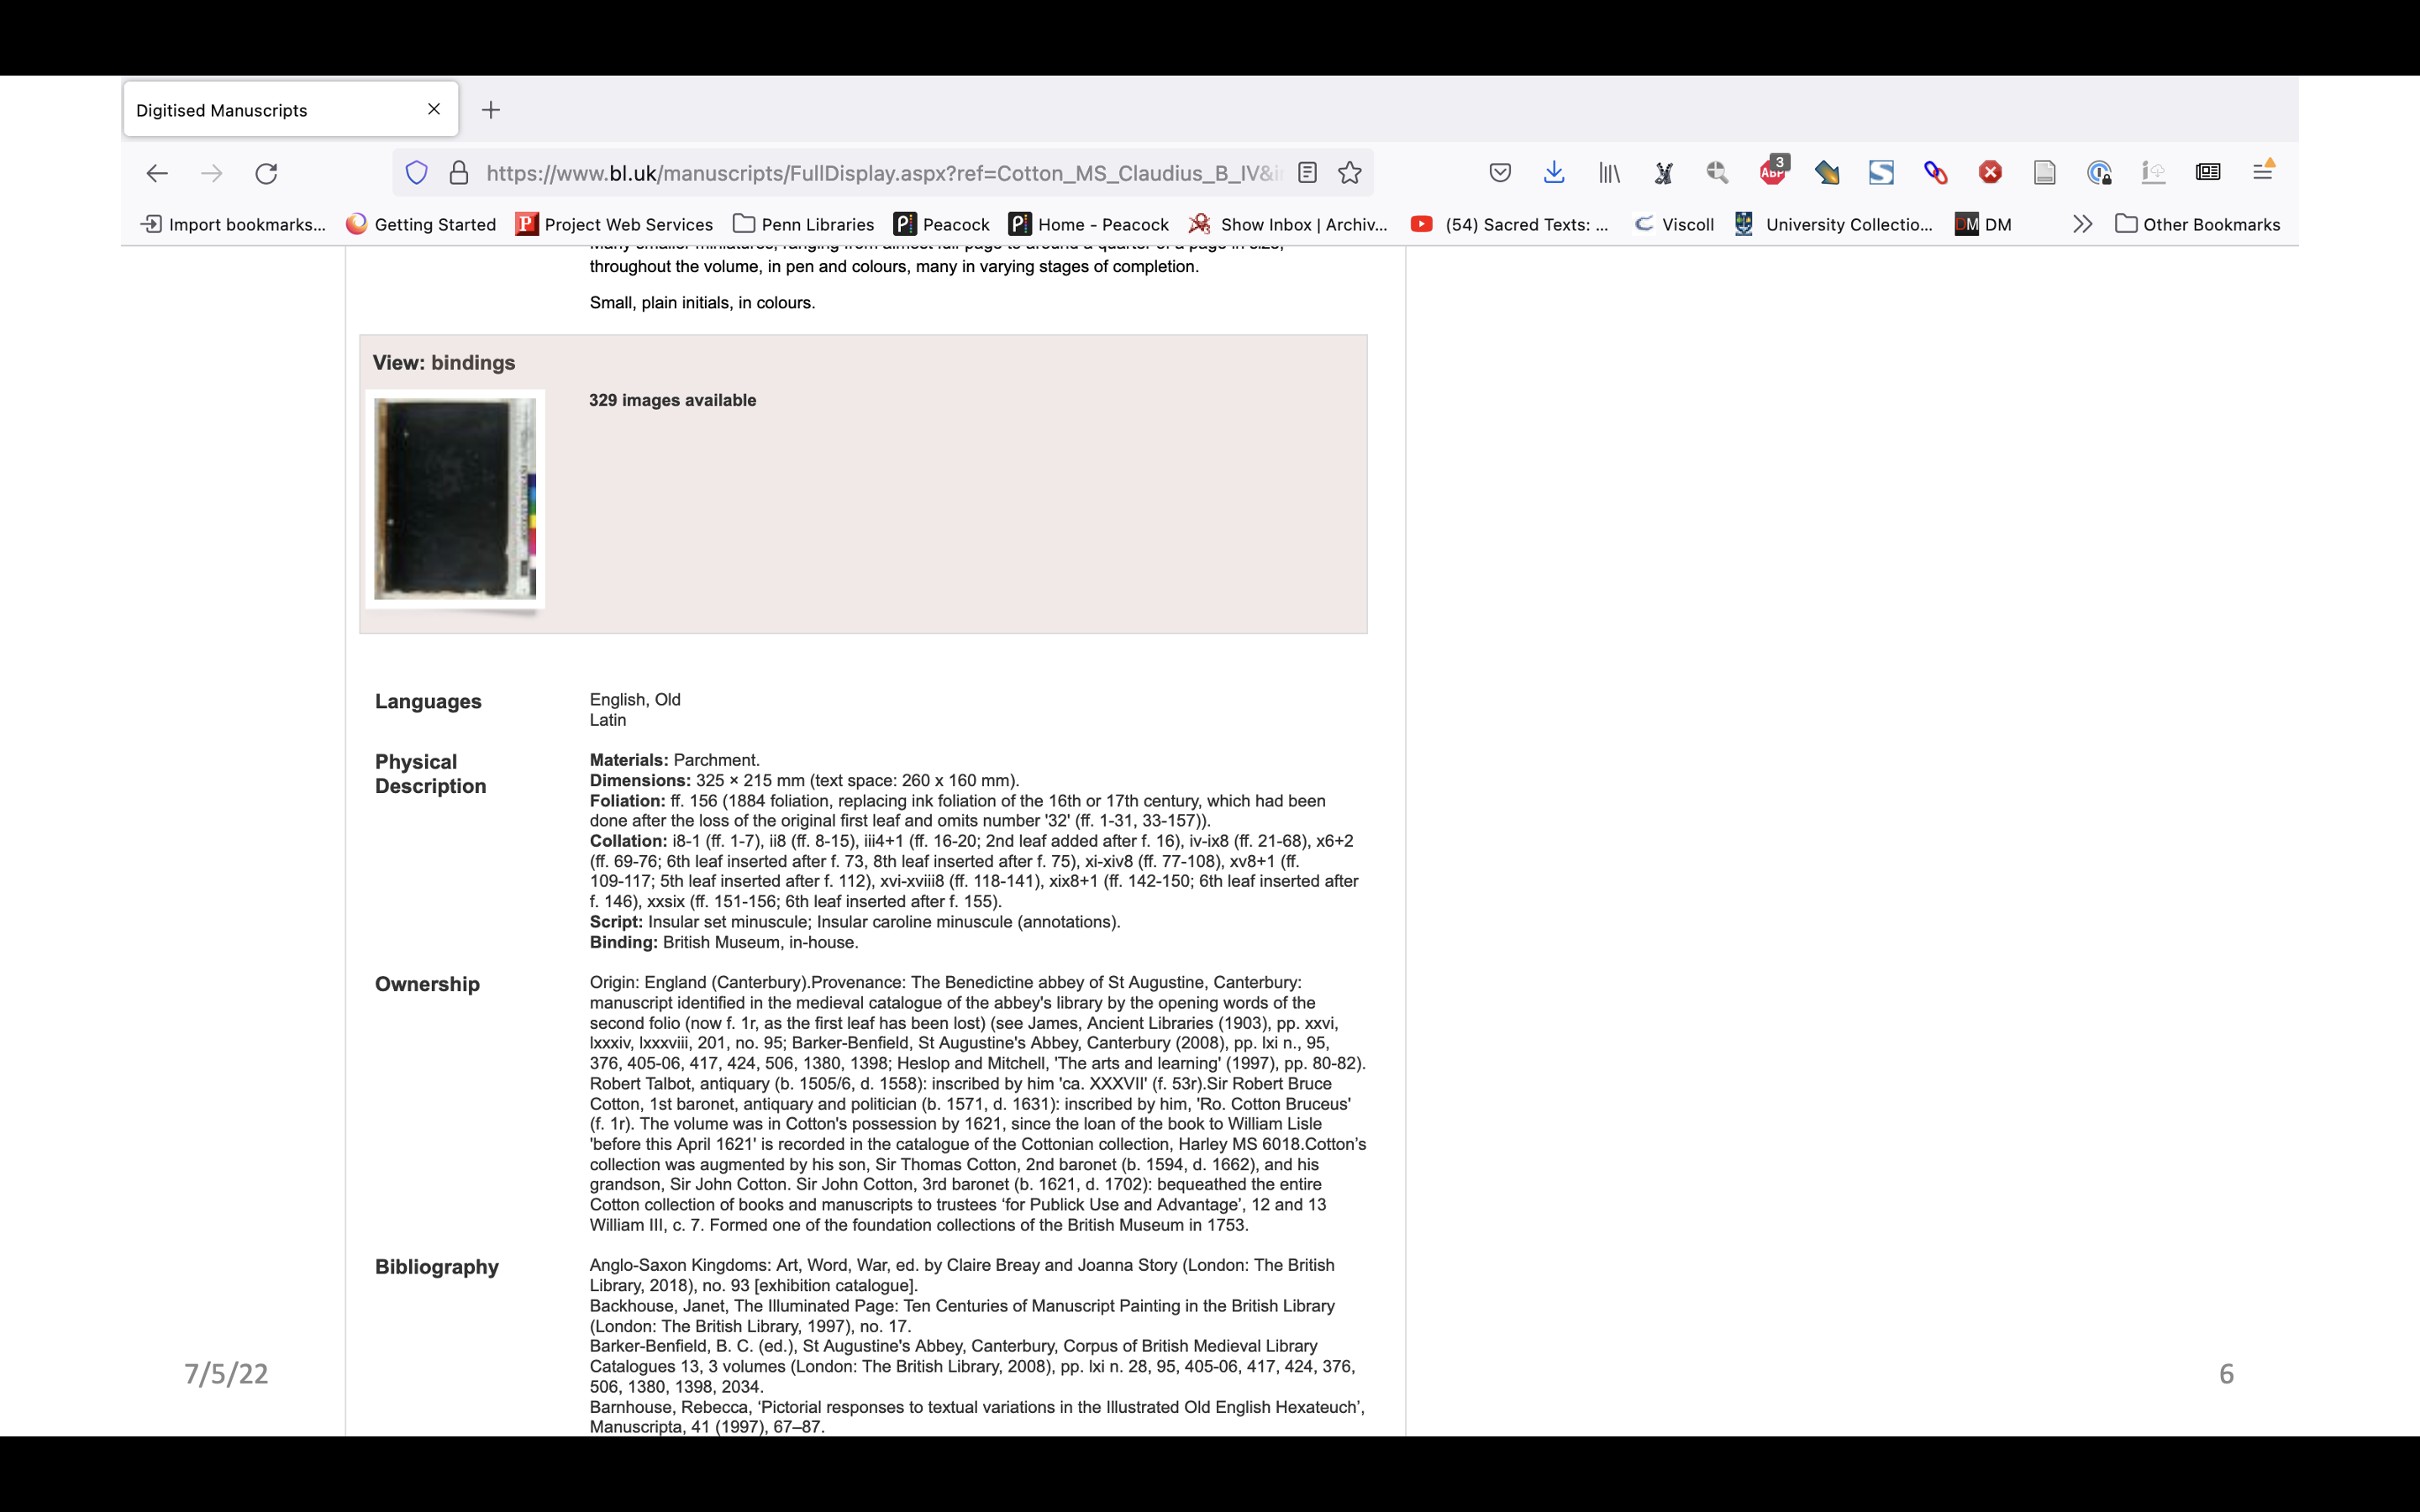
Jumping now from 1957 to 2022. Here is Ms. Cotton Claudius b. iv again on the BL website, and you can see that even though we have moved from print catalogs to online catalogs, to digitized manuscripts we’re still relying on the collation formula for structural description. Even though we’re here in the website, and the digitized images are right here, the structural information is still is divorced from the rest of the description.
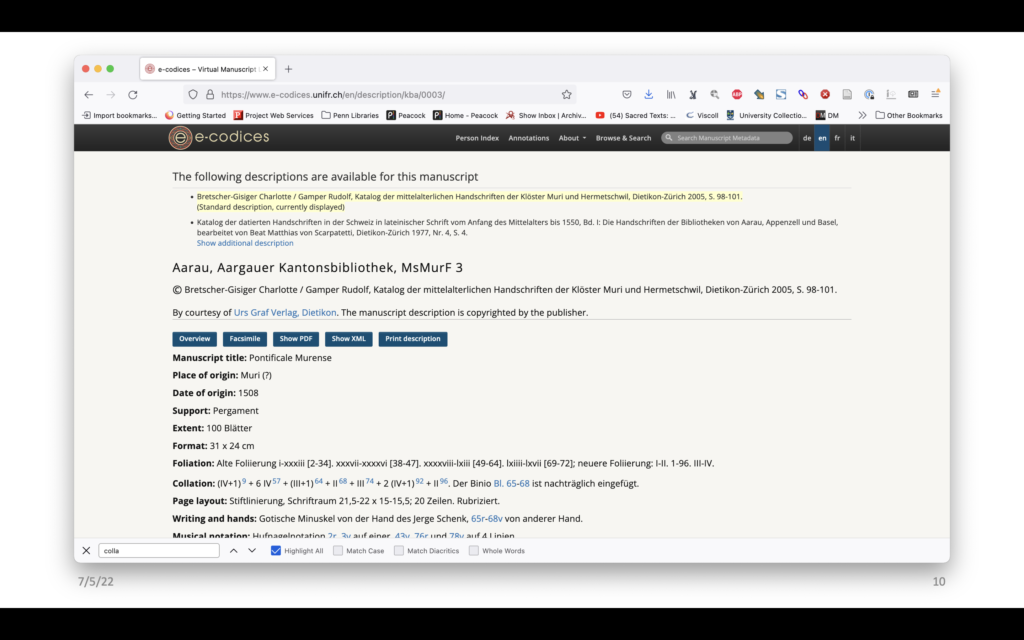
Just one more example to further illustrate the point. E-codices, which is a really fantastic website featuring manuscripts in Switzerland also has collation formulas.
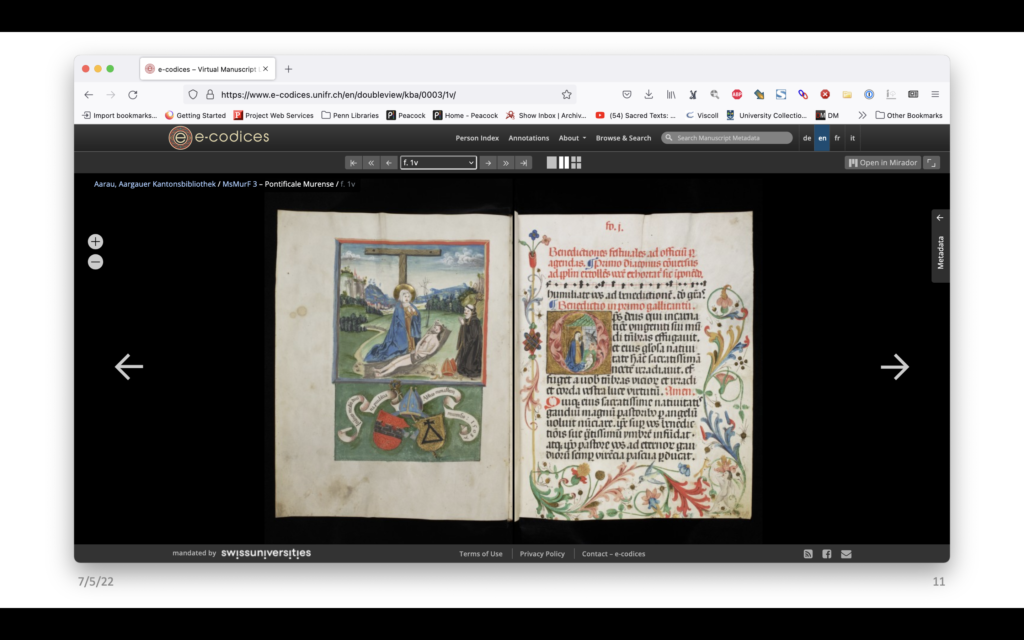
The digital images are presented as flat openings, as well as the usual views you would expect to see in a digitized manuscript library – gallery view, or filmstrip or microfilm style. There is no connection between the information provided in the formula and the way the images are organized on the screen.
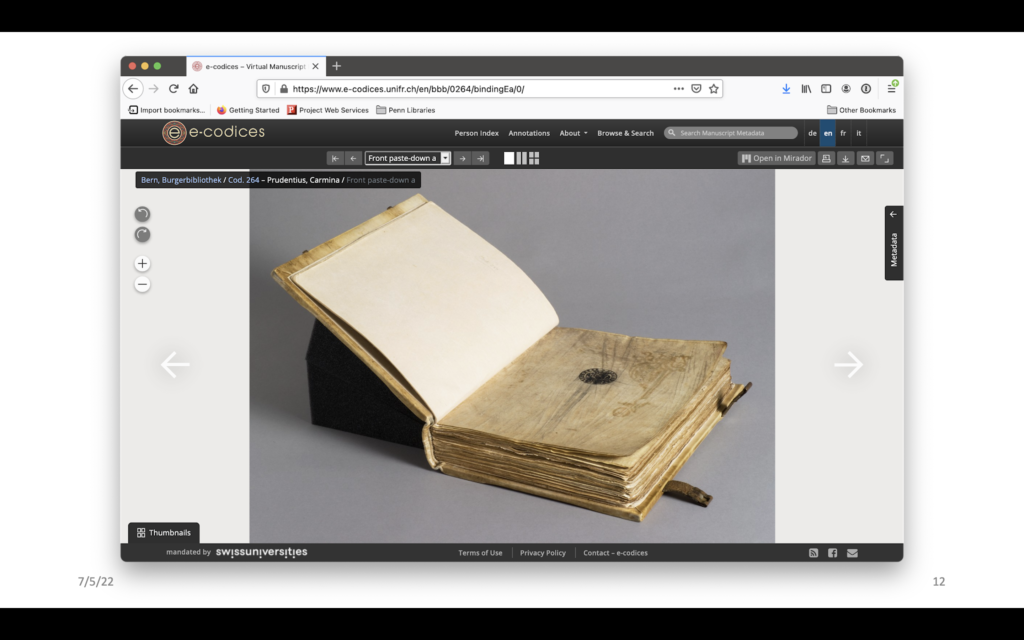
There are some efforts that have been made to present structural information in digitized manuscript libraries. Most will include photos of the spine and edges, and some have started to provide even more. For example in e-codices, which has recently started including photos taken of the whole book in a kind of natural open setting.
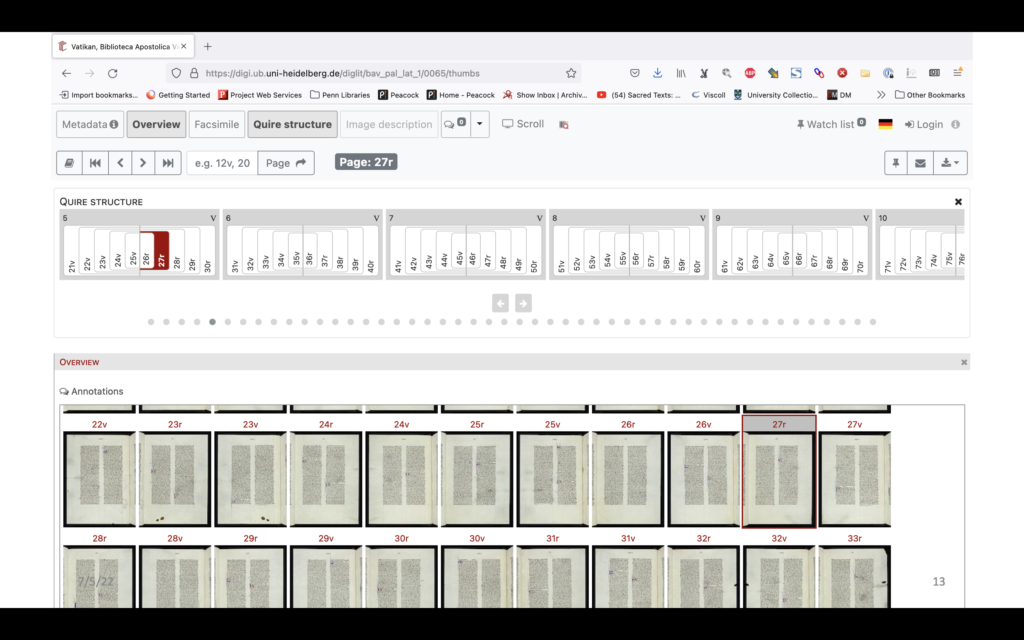
But what about including structural information in the interface itself? This is the digital manuscript library at the University of Heidelberg. They have an option to view the quire structure up here. Here I’ve selected 27 recto, and up here you can see where leaf 27 is within the quire structure. It’s in quire five, and it’s the latter half of the bifolia that is one in from the middle bifolio. I think this is a really good visualization that provides some visual guide to the structure. It doesn’t seem to be used for very many manuscripts on their site, but this is a way to sort of bring that structure in and make it part of the interface.
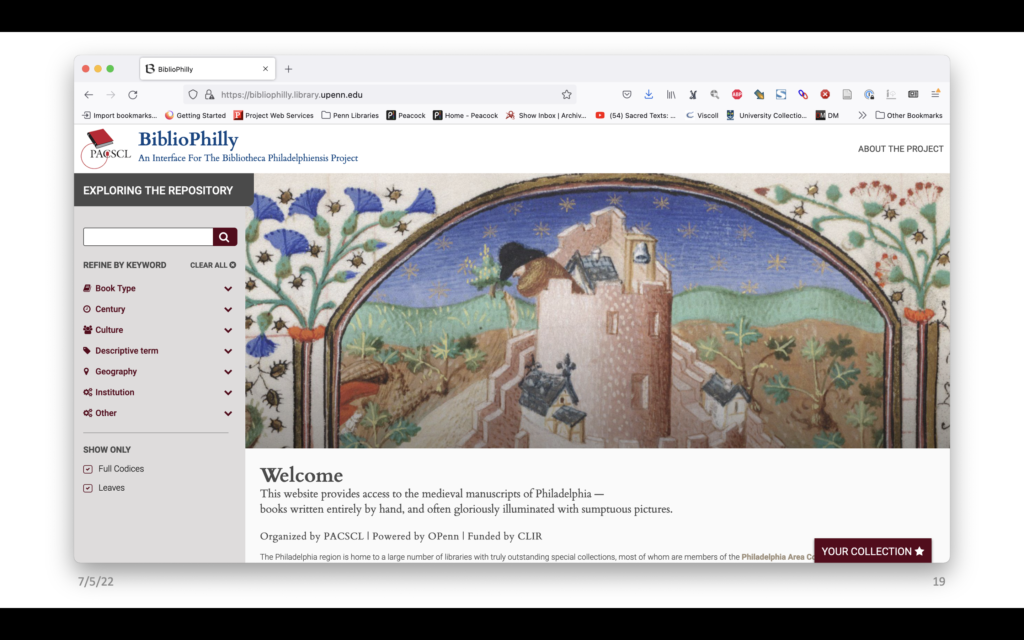
Now I want to talk about the work we’ve been doing at Penn. Bibliotheca Philadelphiensis or BiblioPhilly was a region-wide collaborative project, funded by the Council on Library and Information Resources (CLIR) and organized by the Philadelphia Area Consortium of Special Collections Libraries (PACSCL), that we undertook in Philadelphia, from 2016 to 2019. Through BiblioPhilly the collaborative team representing 15 institutions digitized and made available online 475 manuscripts from collections across Philadelphia.
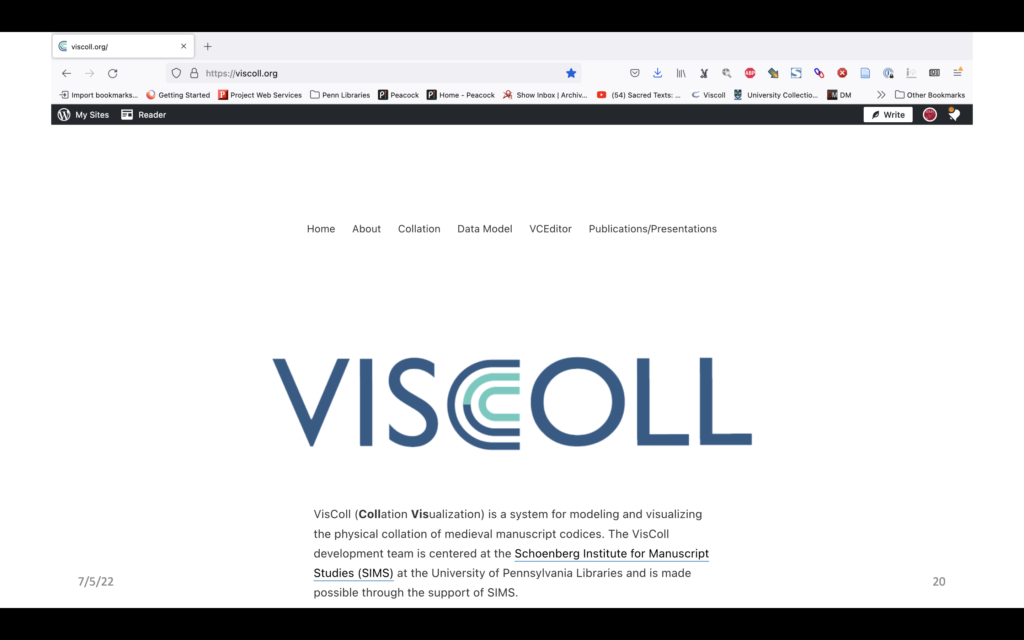
As part of our part of our cataloging work we leveraged a project that I have been directing at Penn pretty much since I arrived in 2013 – VisColl, which stands for visualizing collation.
At the time that we were starting the work on BiblioPhilly, we had just launched our alpha version of software that we could use to build collation models, and visualize them. So as part of our catalog, we – we being me, our manuscripts cataloger Amey Hutchins, Schoenberg Curator of Manuscripts Nick Herman, and some other people created a collation model for each manuscript not really knowing what we’re going to be doing with them, but hoping we would be able to do something.
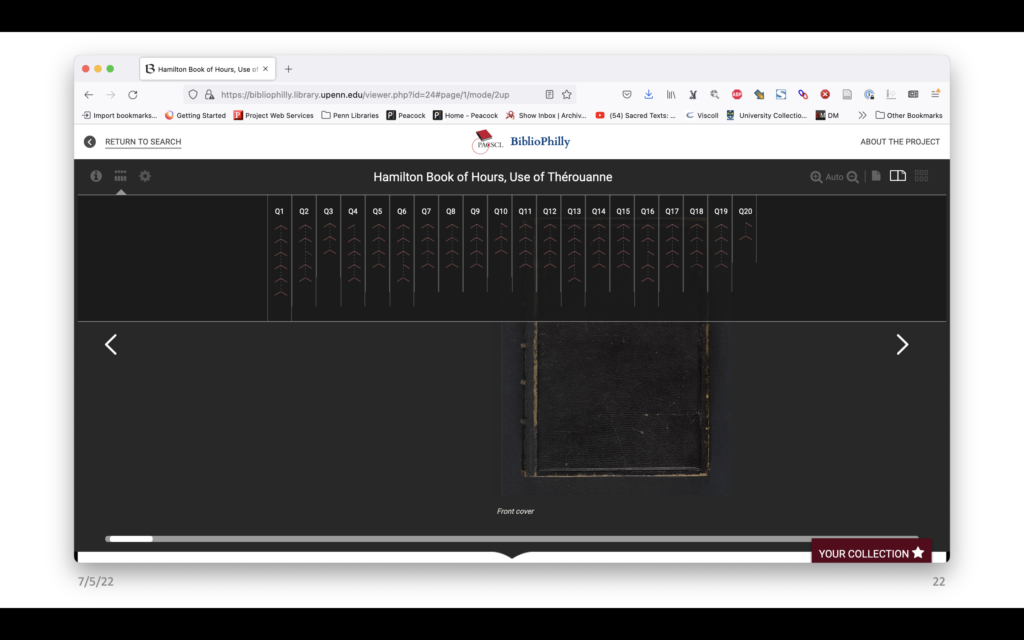
As we reached the end of the project, Penn made funding available to the project to hire a software developer, and we worked with them to make an interface to present the project in its own purpose-built environment, including a visualization of the collation models. Now if you go to https://bibliophilly.library.upenn.edu/, on some of the records you’ll see this icon on the left and if you click on that, you’ll get a drop down, that shows you all of our quires and how many, how many leaves and how the leaves are arranged.
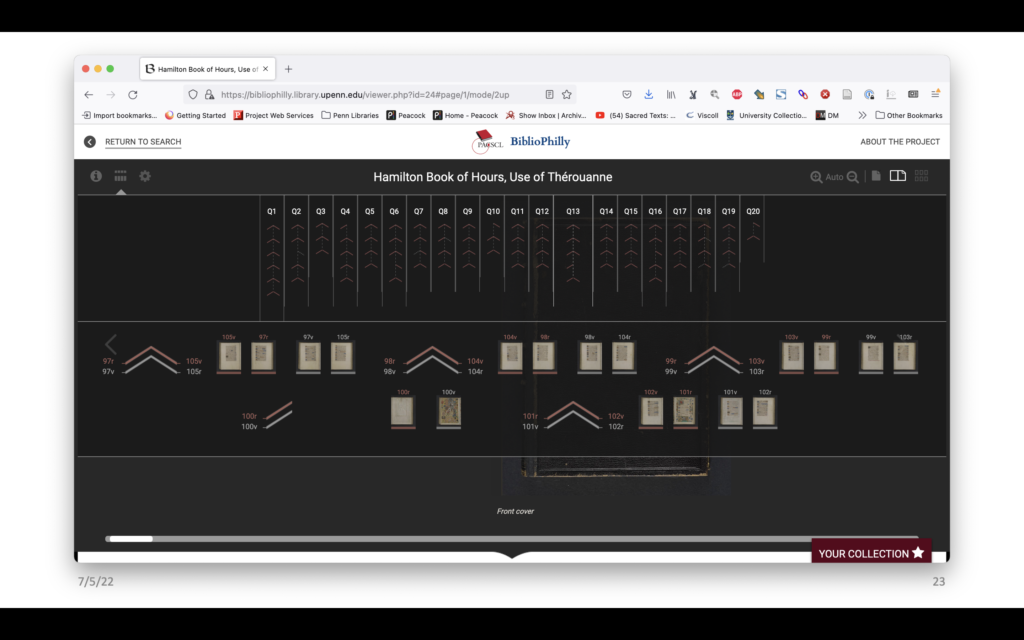
Selecting quire 13 we can see the bifolia going across from the outside to the bifolio that forms the facing page in the center of the quire. This is the outer bifolio – that is, the side of the bifolio that faces the outside of the quire when it’s closed, and then the inner, which faces inside, and in this example is the facing page in the center of the quire.
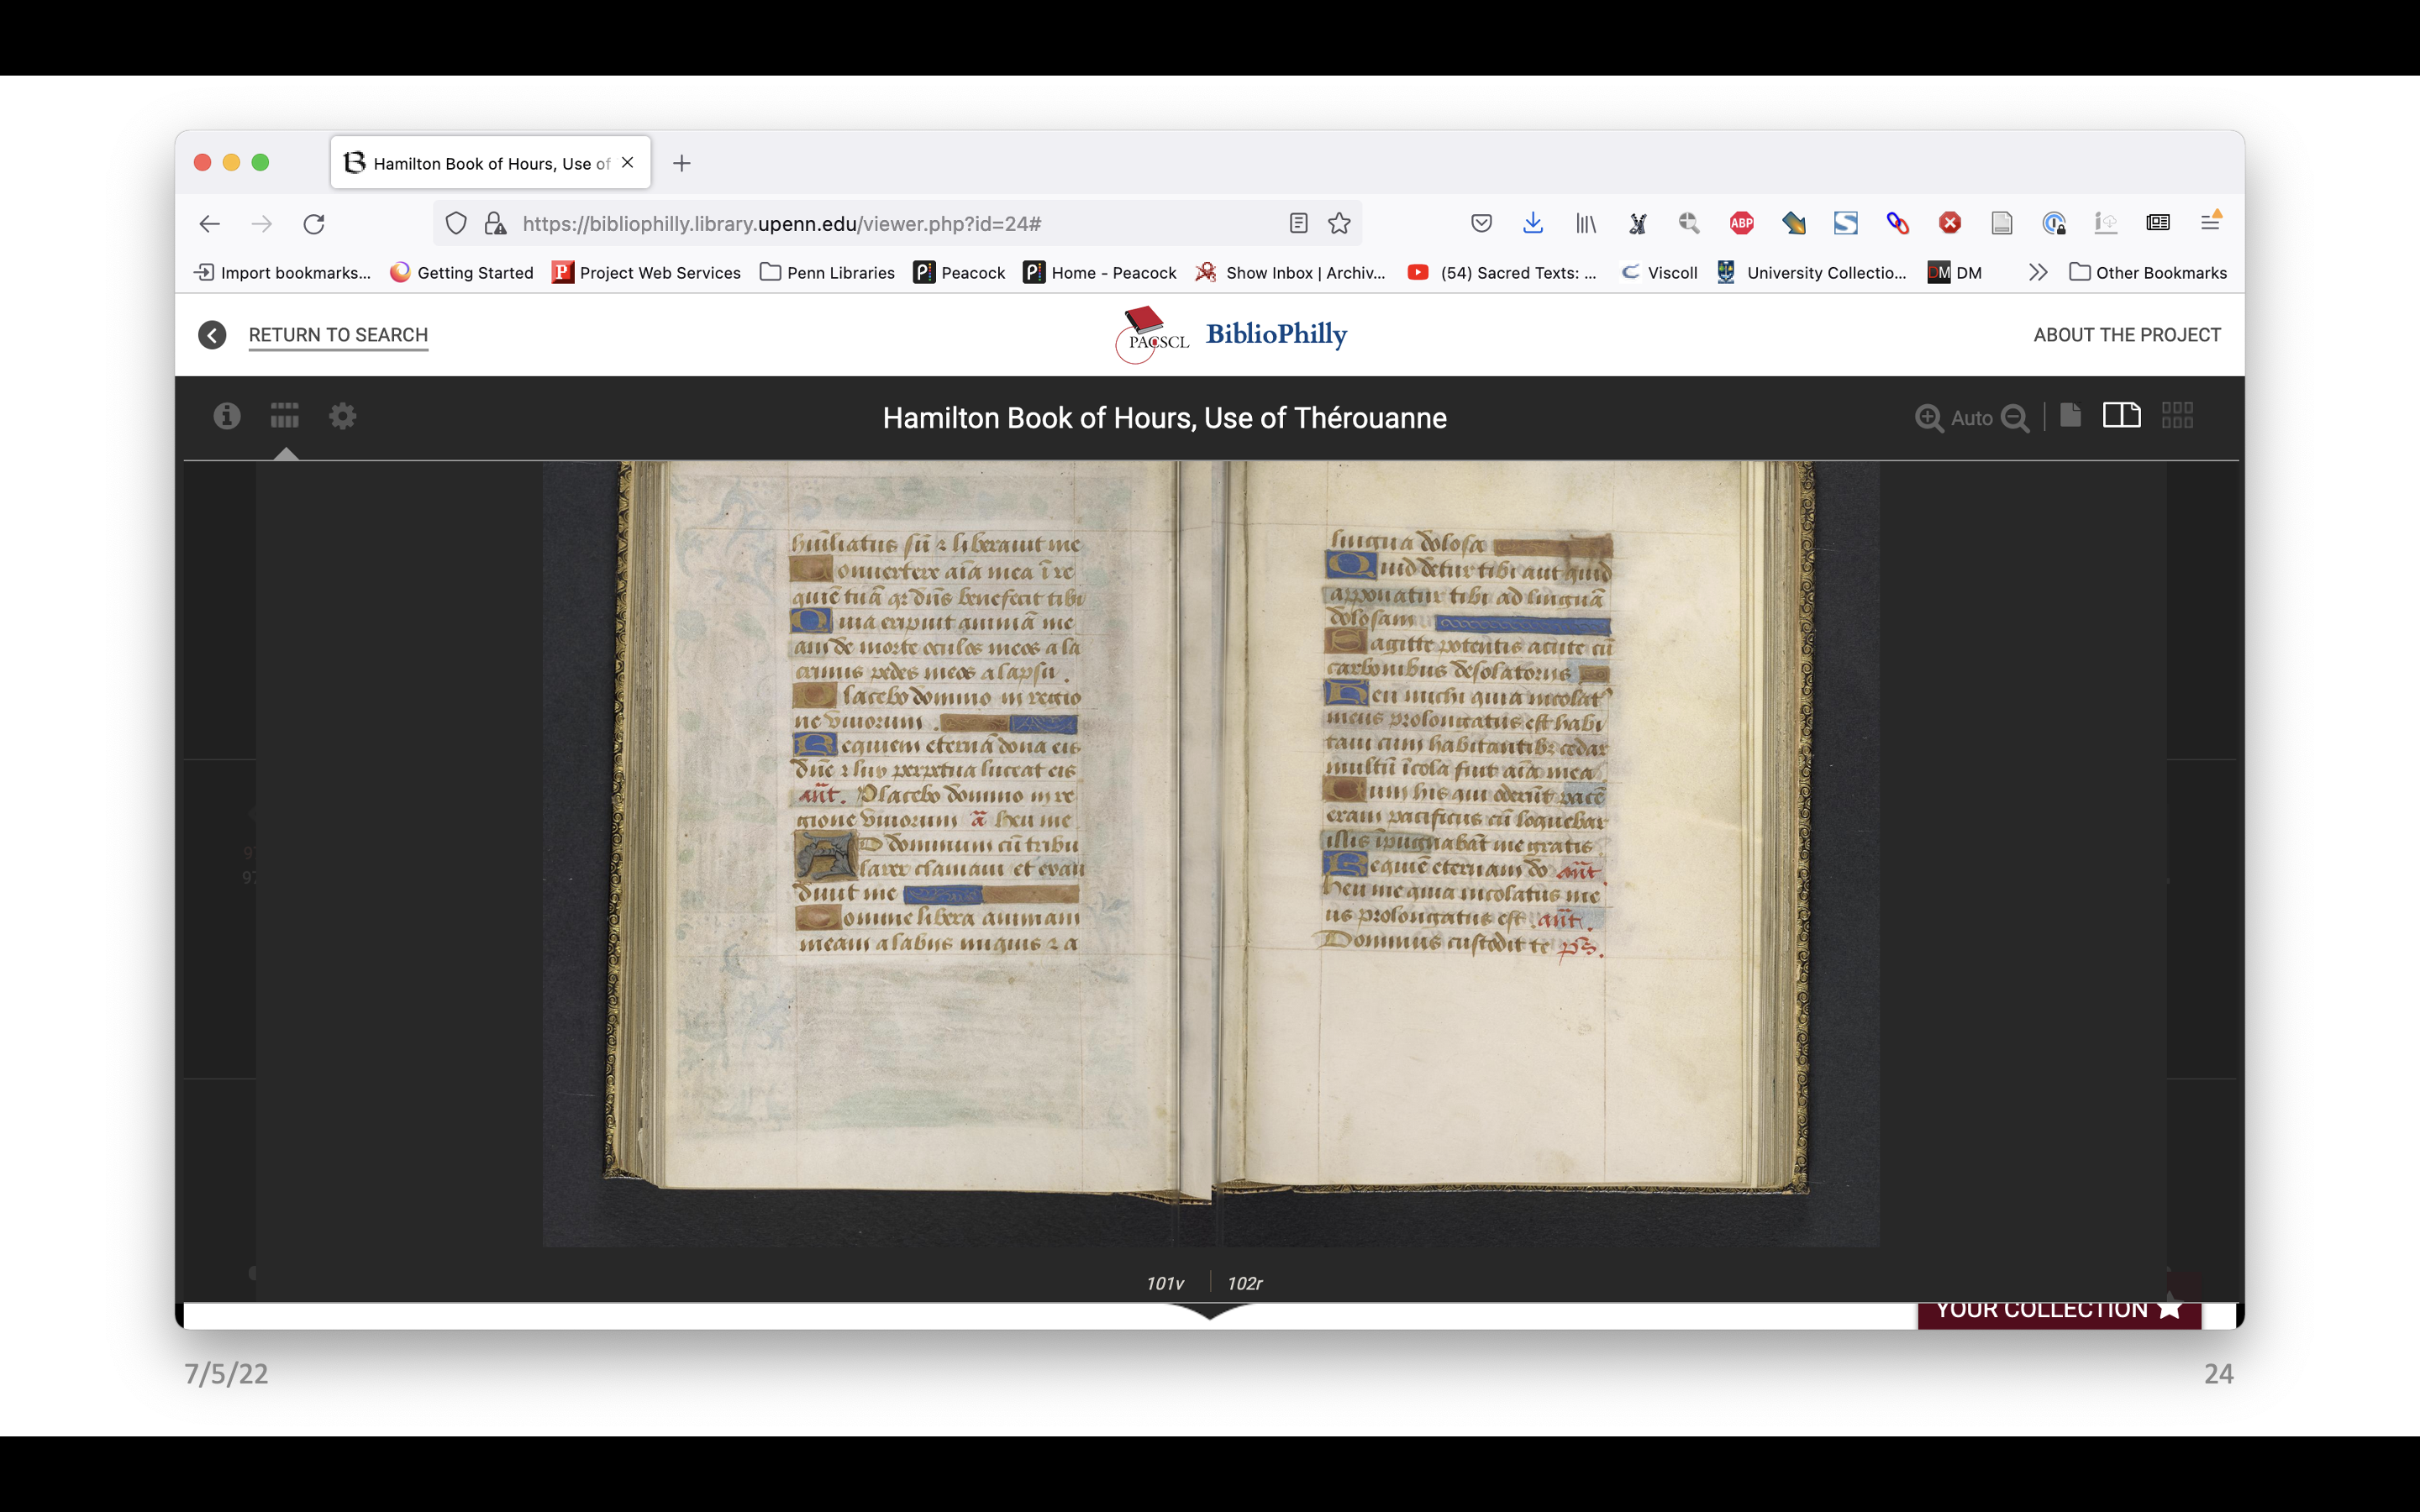
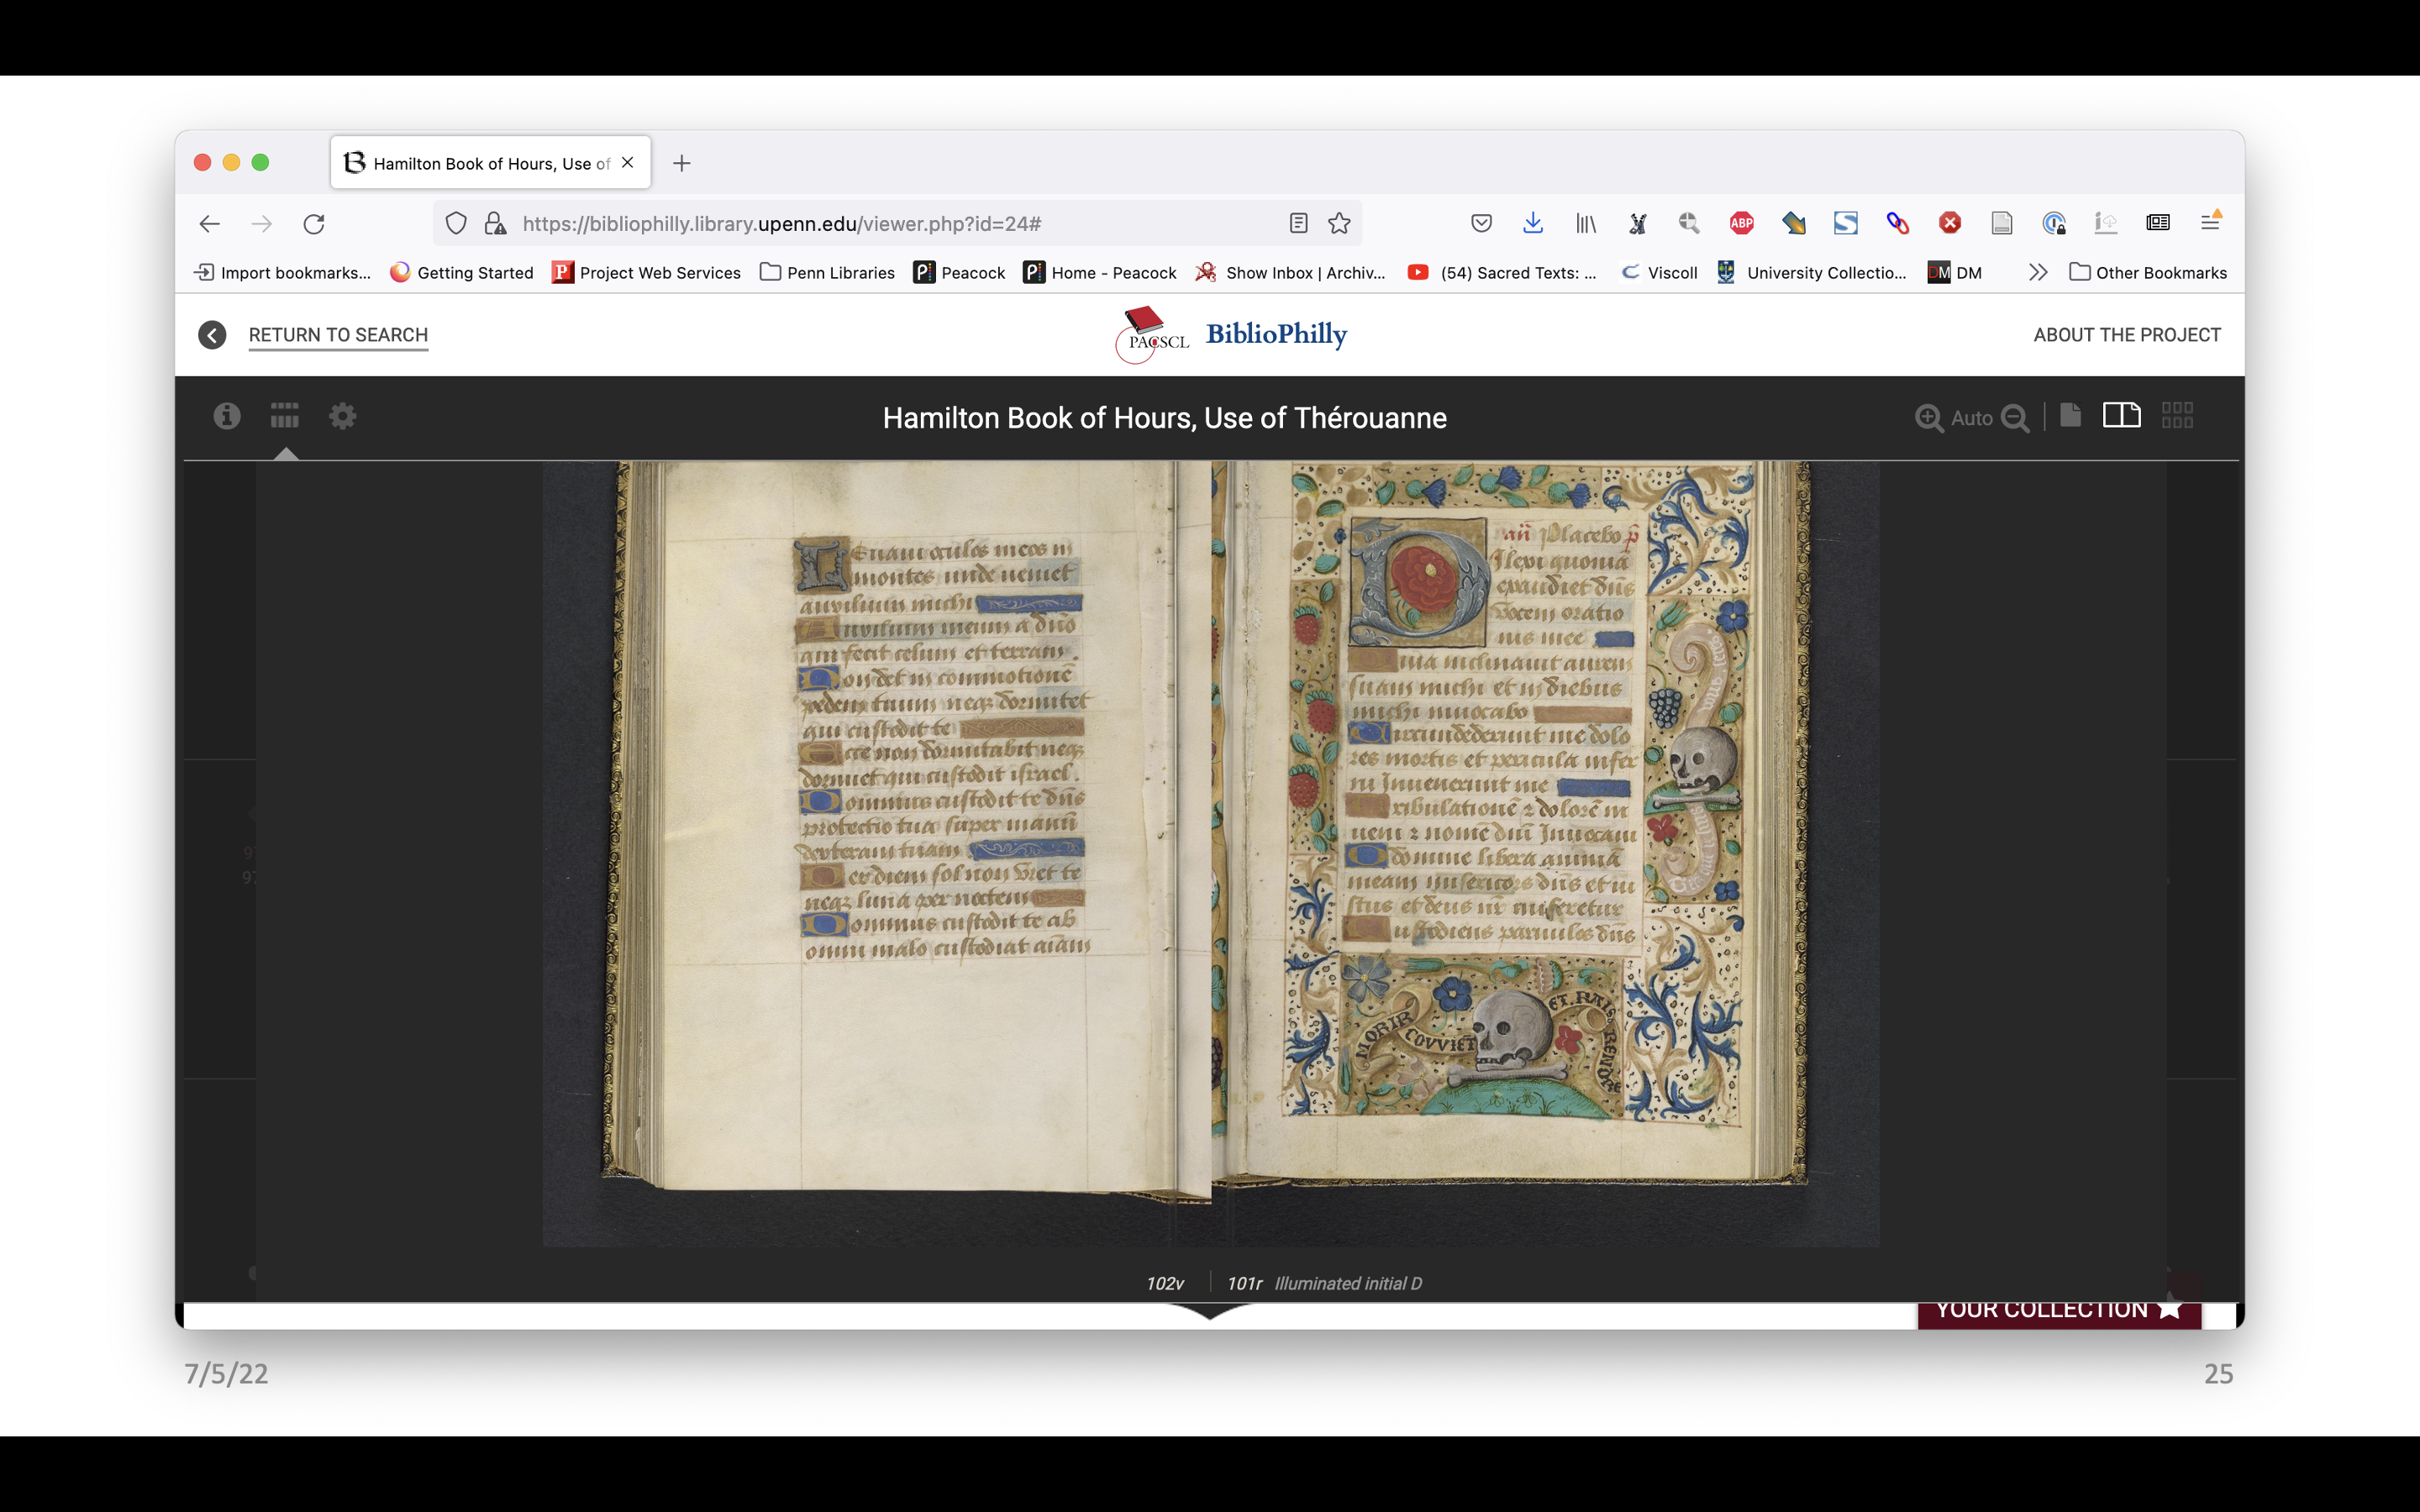
This is very interesting, but most collections aren’t going to have the resources to build a new interface just to display structural data in a visual way. It has the potential to be a huge undertaking, and we need other options.
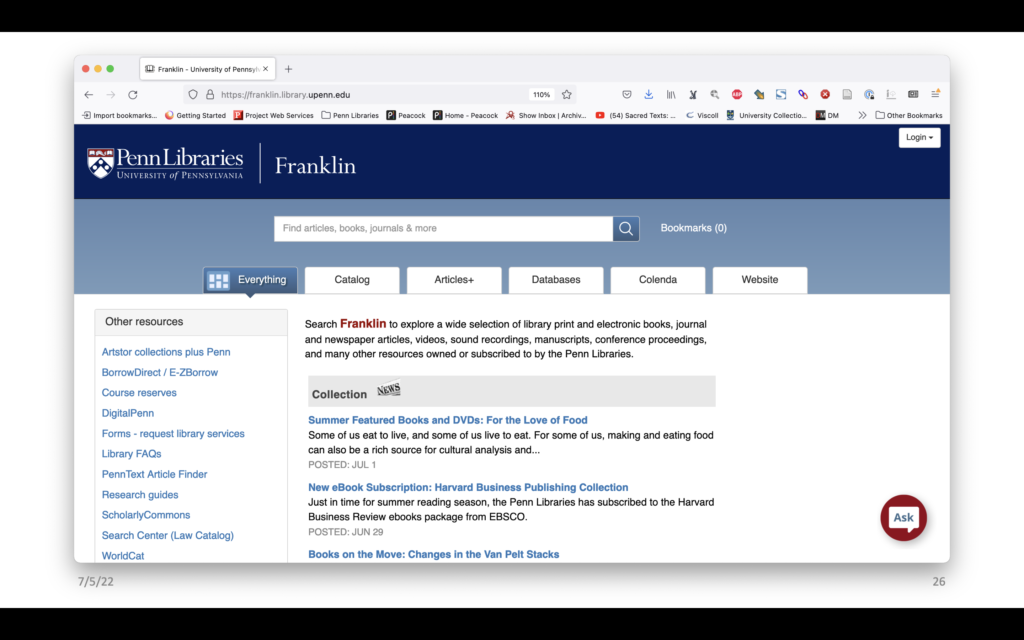
This is Franklin, it’s the online public access catalogue for Penn. All the library’s materials are in here, manuscripts and printed books and ebooks, special collections and general collections, it’s all here.
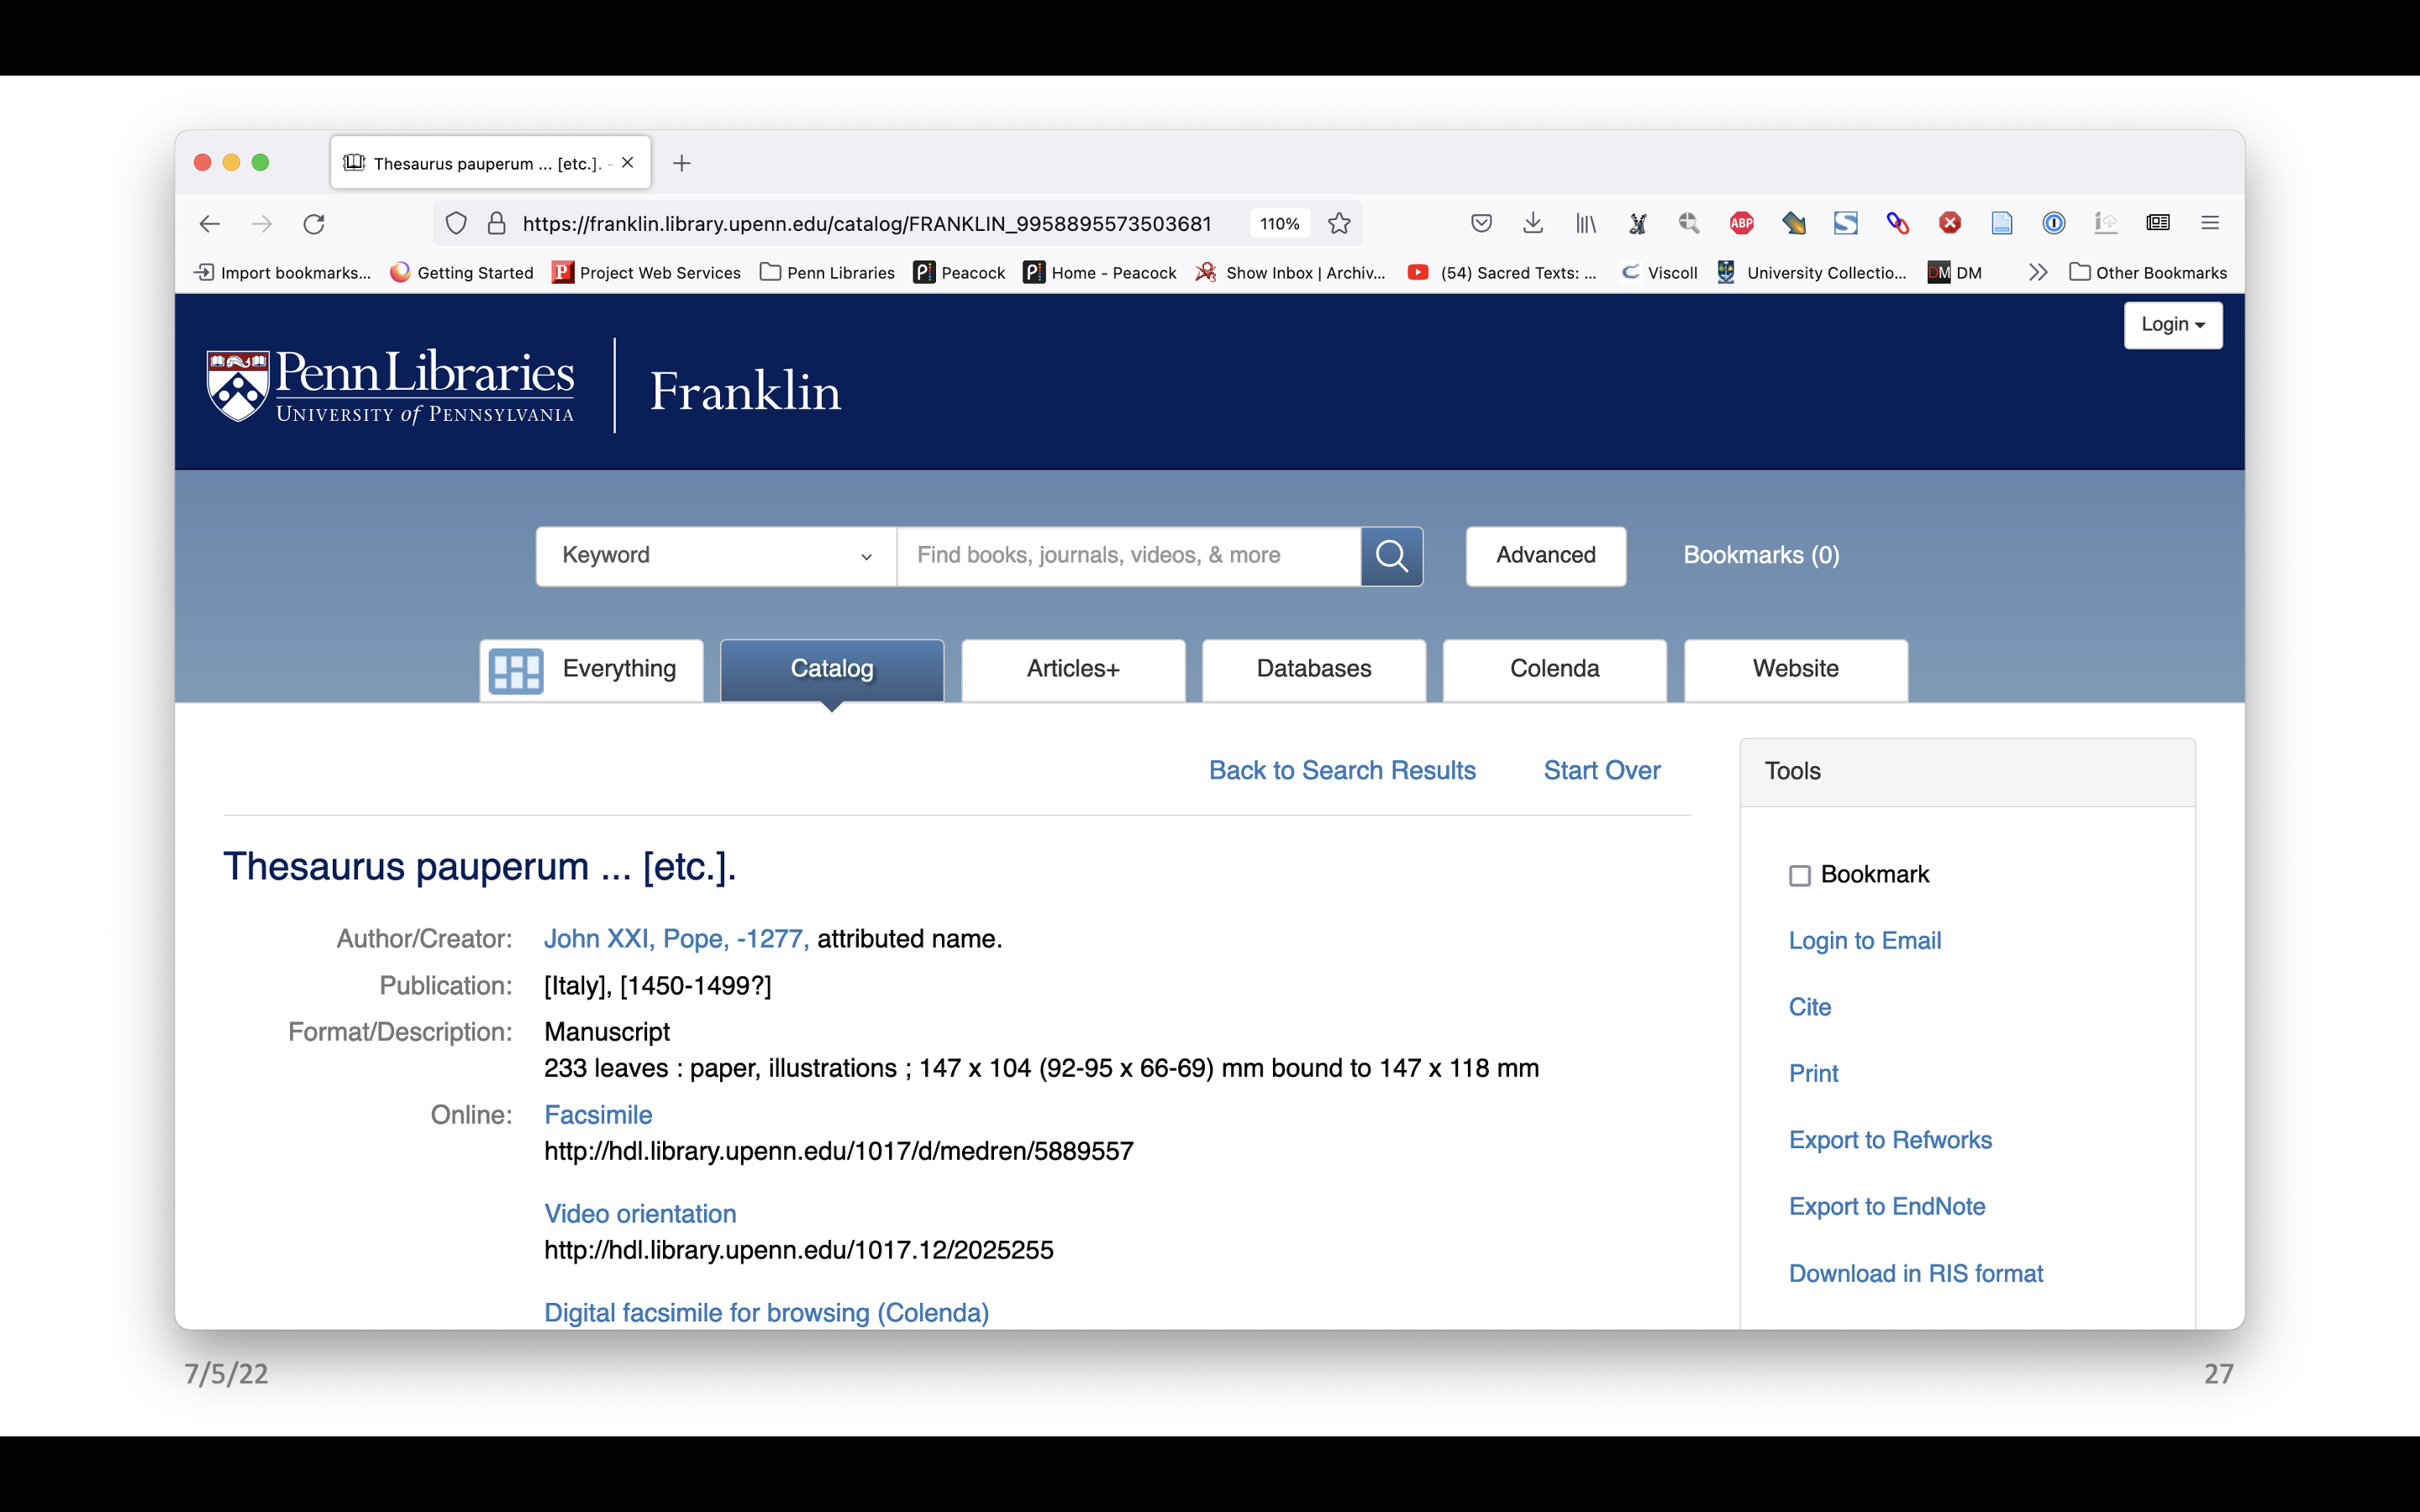
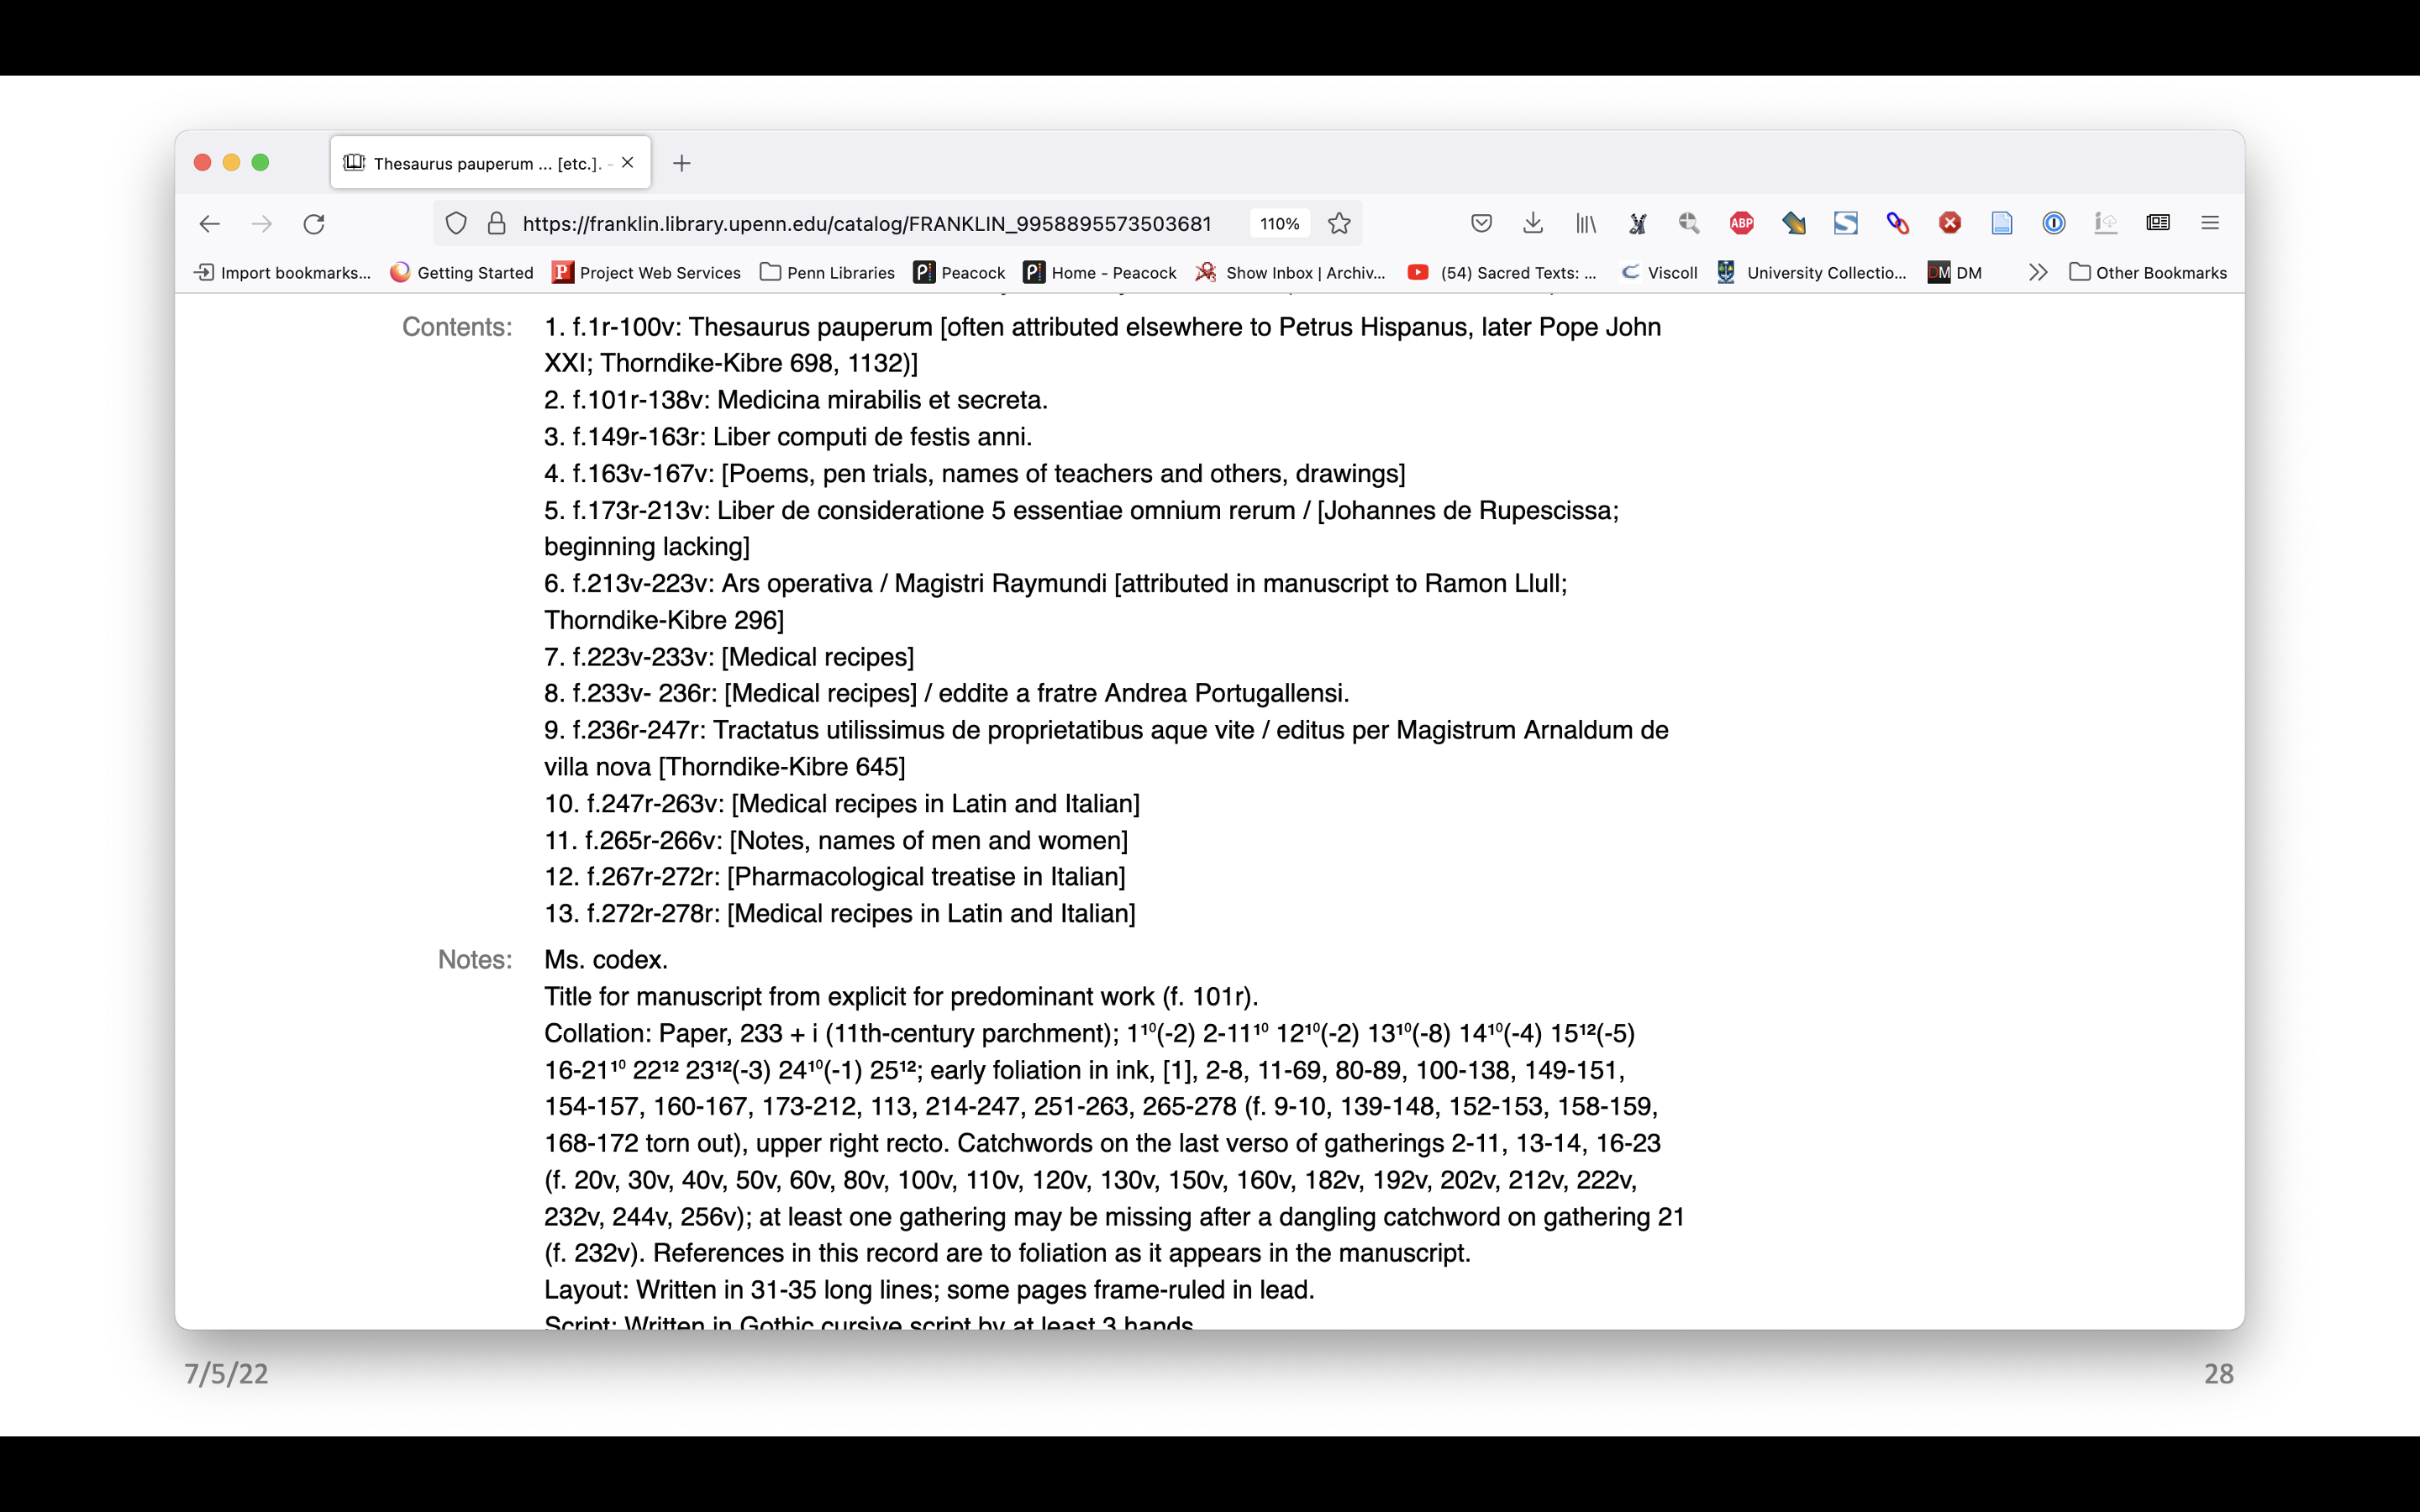
Here is the record in Franklin for LJS 236, a medical miscellany written in Italy in the last half of the 15th century. At the top we have links to some different digital versions, including three different facsimiles – all the same image files but in different interfaces, including one in our Colenda Repository that is IIIF compliant. Further down there’s more of the record, including the contents and then notes, which includes a collation note with a formula and some additional description.
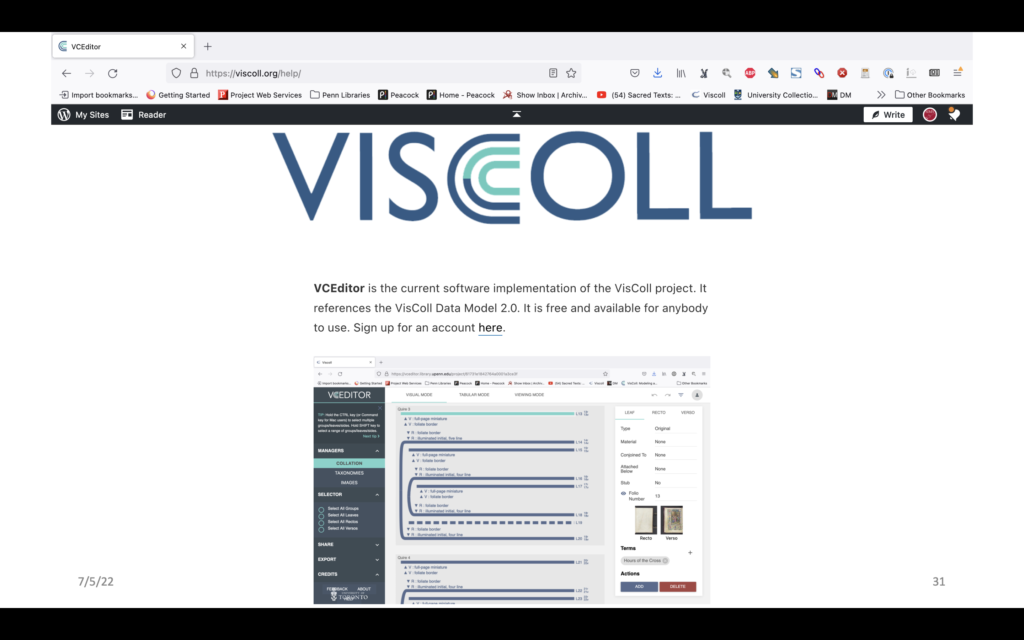
So we have images, we have a collation formula in Franklin, and as of September of last year we have VCEditor, the most recent software for building VisColl models. VCEditor is built on a system called VisCodex, which was developed at the University of Toronto at the Old Books New Science Lab under the direction of Alexandra Gillespie.
This April I spent a month at the University of Glasgow as a Visiting Research Fellow, and while I was there I build collation models in VCEditor for most of the pre-1700 manuscripts from their Hunterian Collection. Before I went I spent a lot of time building initial models from collation formulas from the 1908 print catalogue. That is, I did use the collation models, not as an endpoint but as a starting point. When I build models from a formula it is clear when there are issues. For example, when my model says there are some number of leaves in the model, but the record says the manuscript has some other number of leaves – that would need to be checked. So that checking is what I did in Glasgow, and I ended up with 293 total models, including 119 manuscripts that I checked in the reading room (that is, I was able to build 174 models that agreed with the formulas and descriptions, without checking against the manuscript).
That was a really good experience.
After returning to Penn in May I started on a pilot project to build models for our manuscripts. I’ve been using the same process I used for Glasgow, starting with formulas from our records as a starting point and then looking at looking at the manuscripts when it’s clear there are issues. An advantage for the pilot project is that unlike the Hunterian Collection, which is only partially digitized and very few of those are publicly available, the manuscripts at Penn are all digitized. This means I can load them into the initial model, and map them to the model. It can be really helpful to have the images as a guide – for example, sometimes you can see thread in the gutter, so you can check to see if you’re really in the middle of a quire, or if you need to reevaluate.
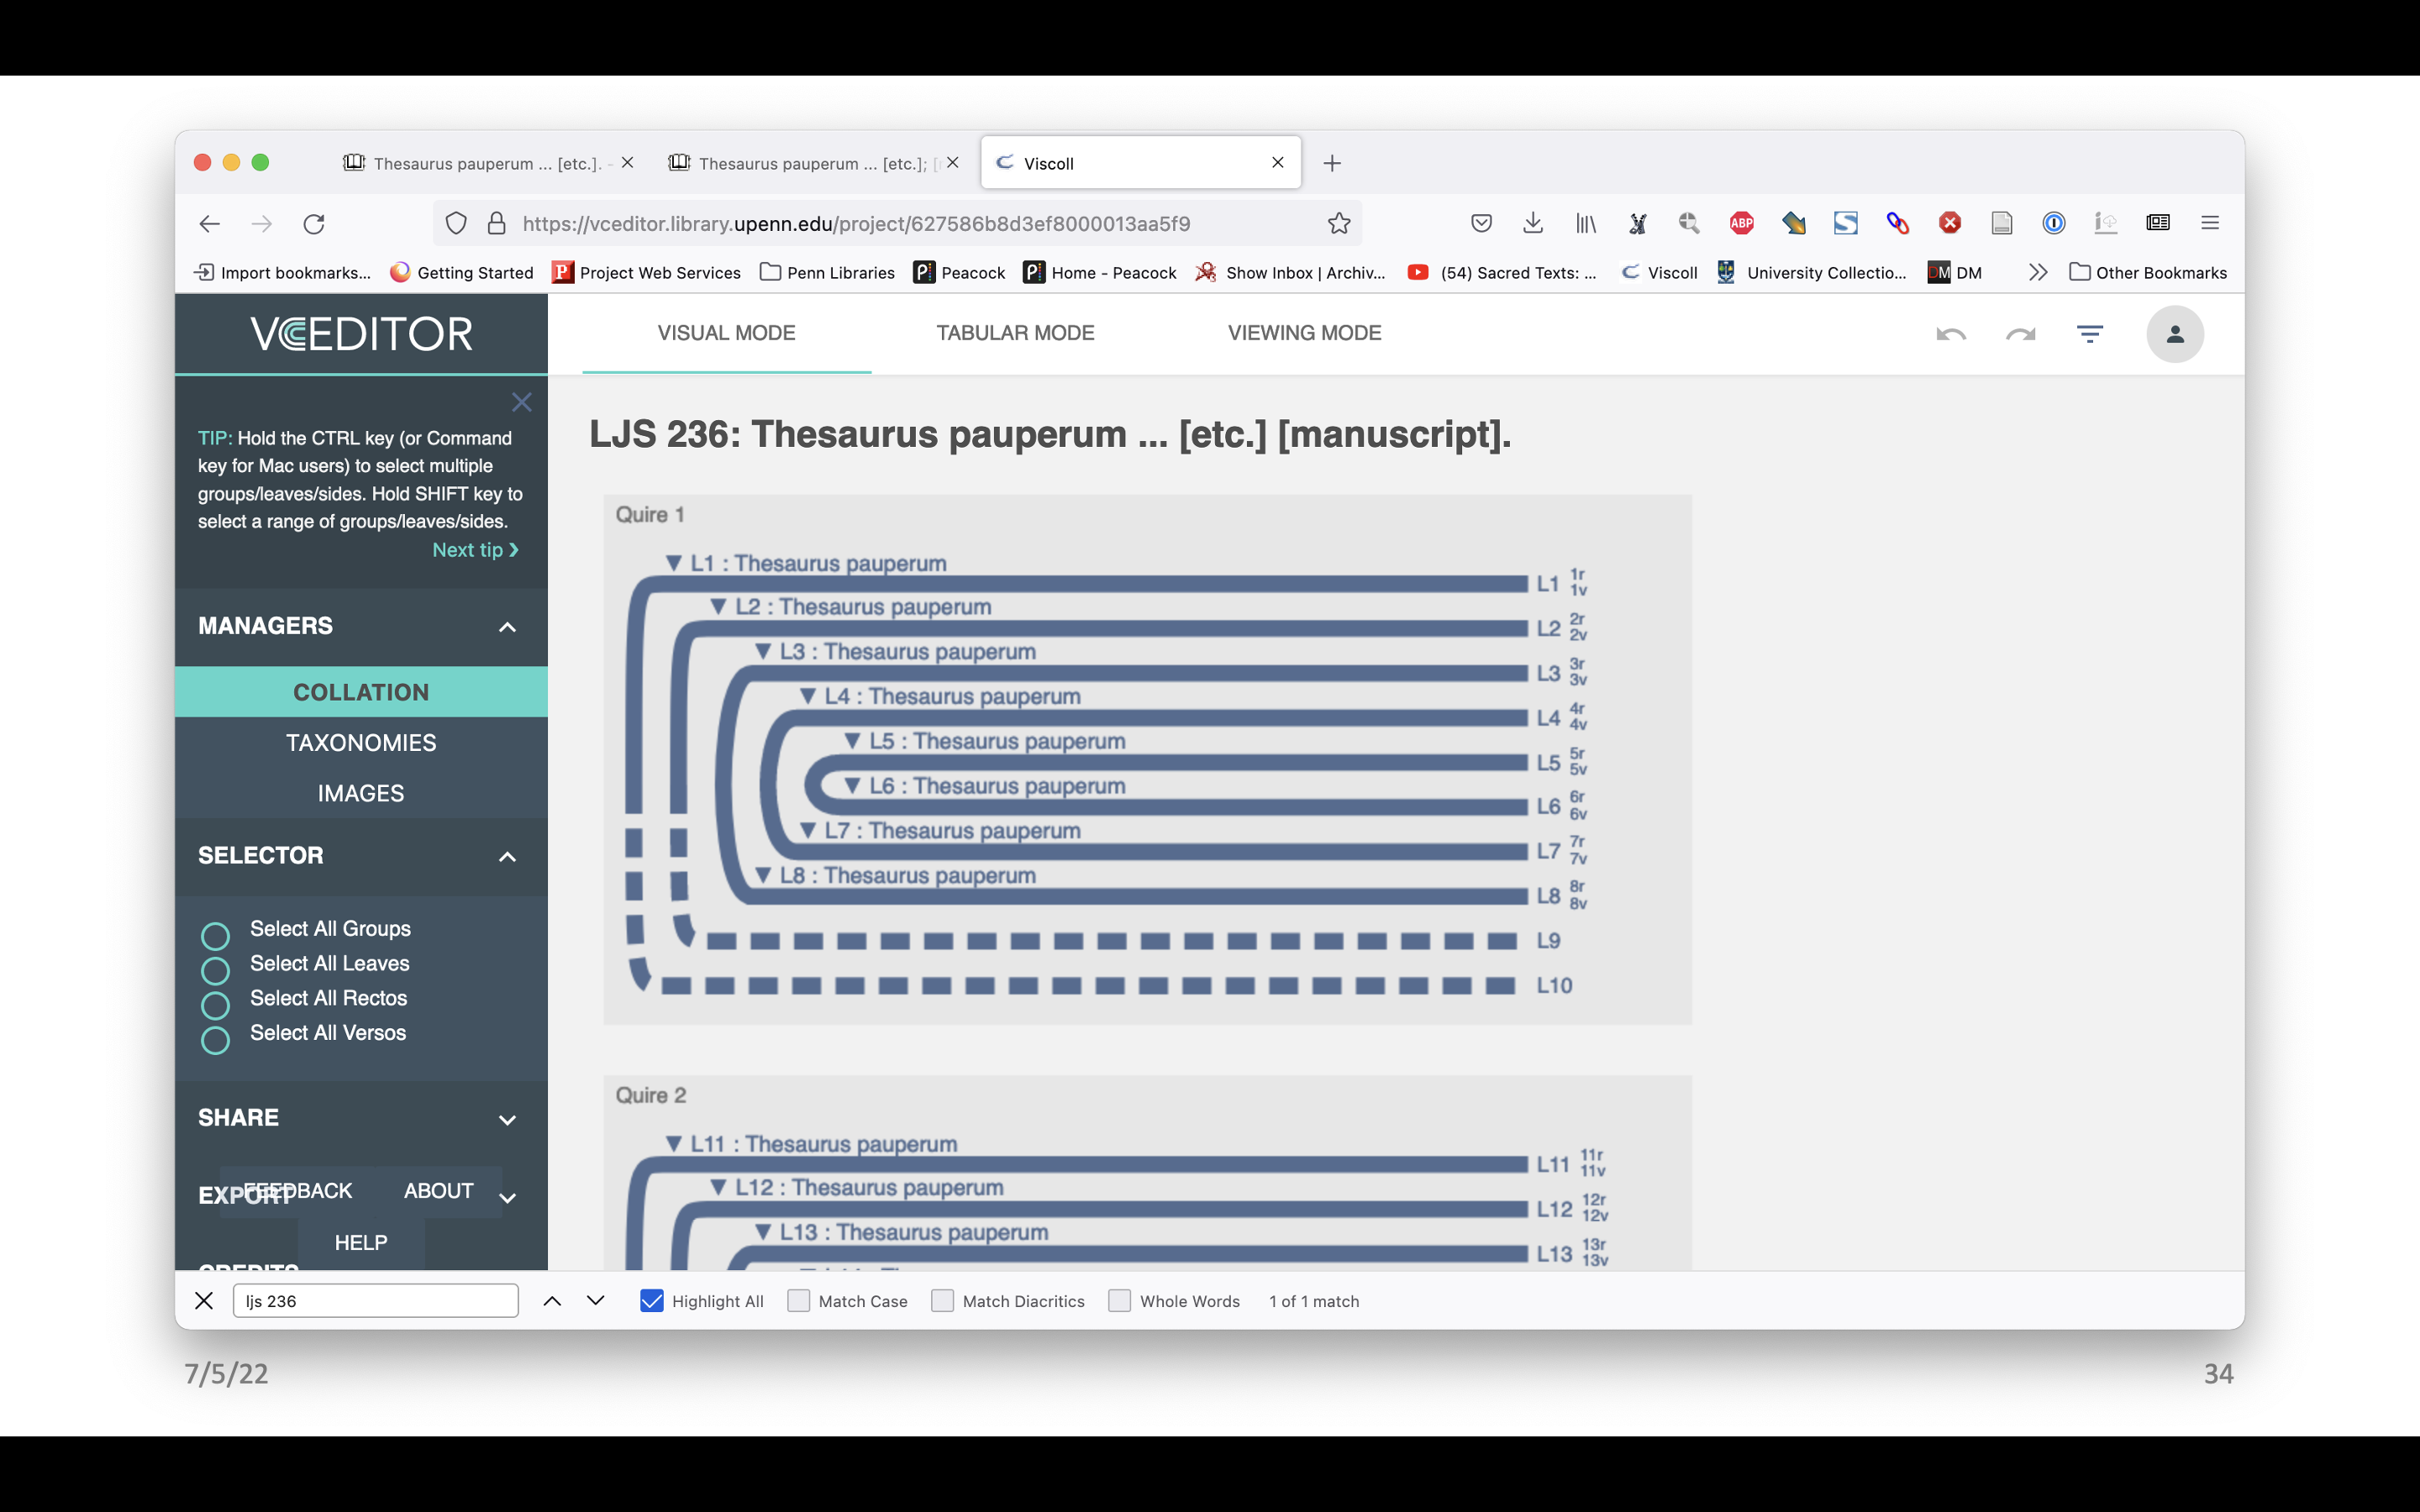
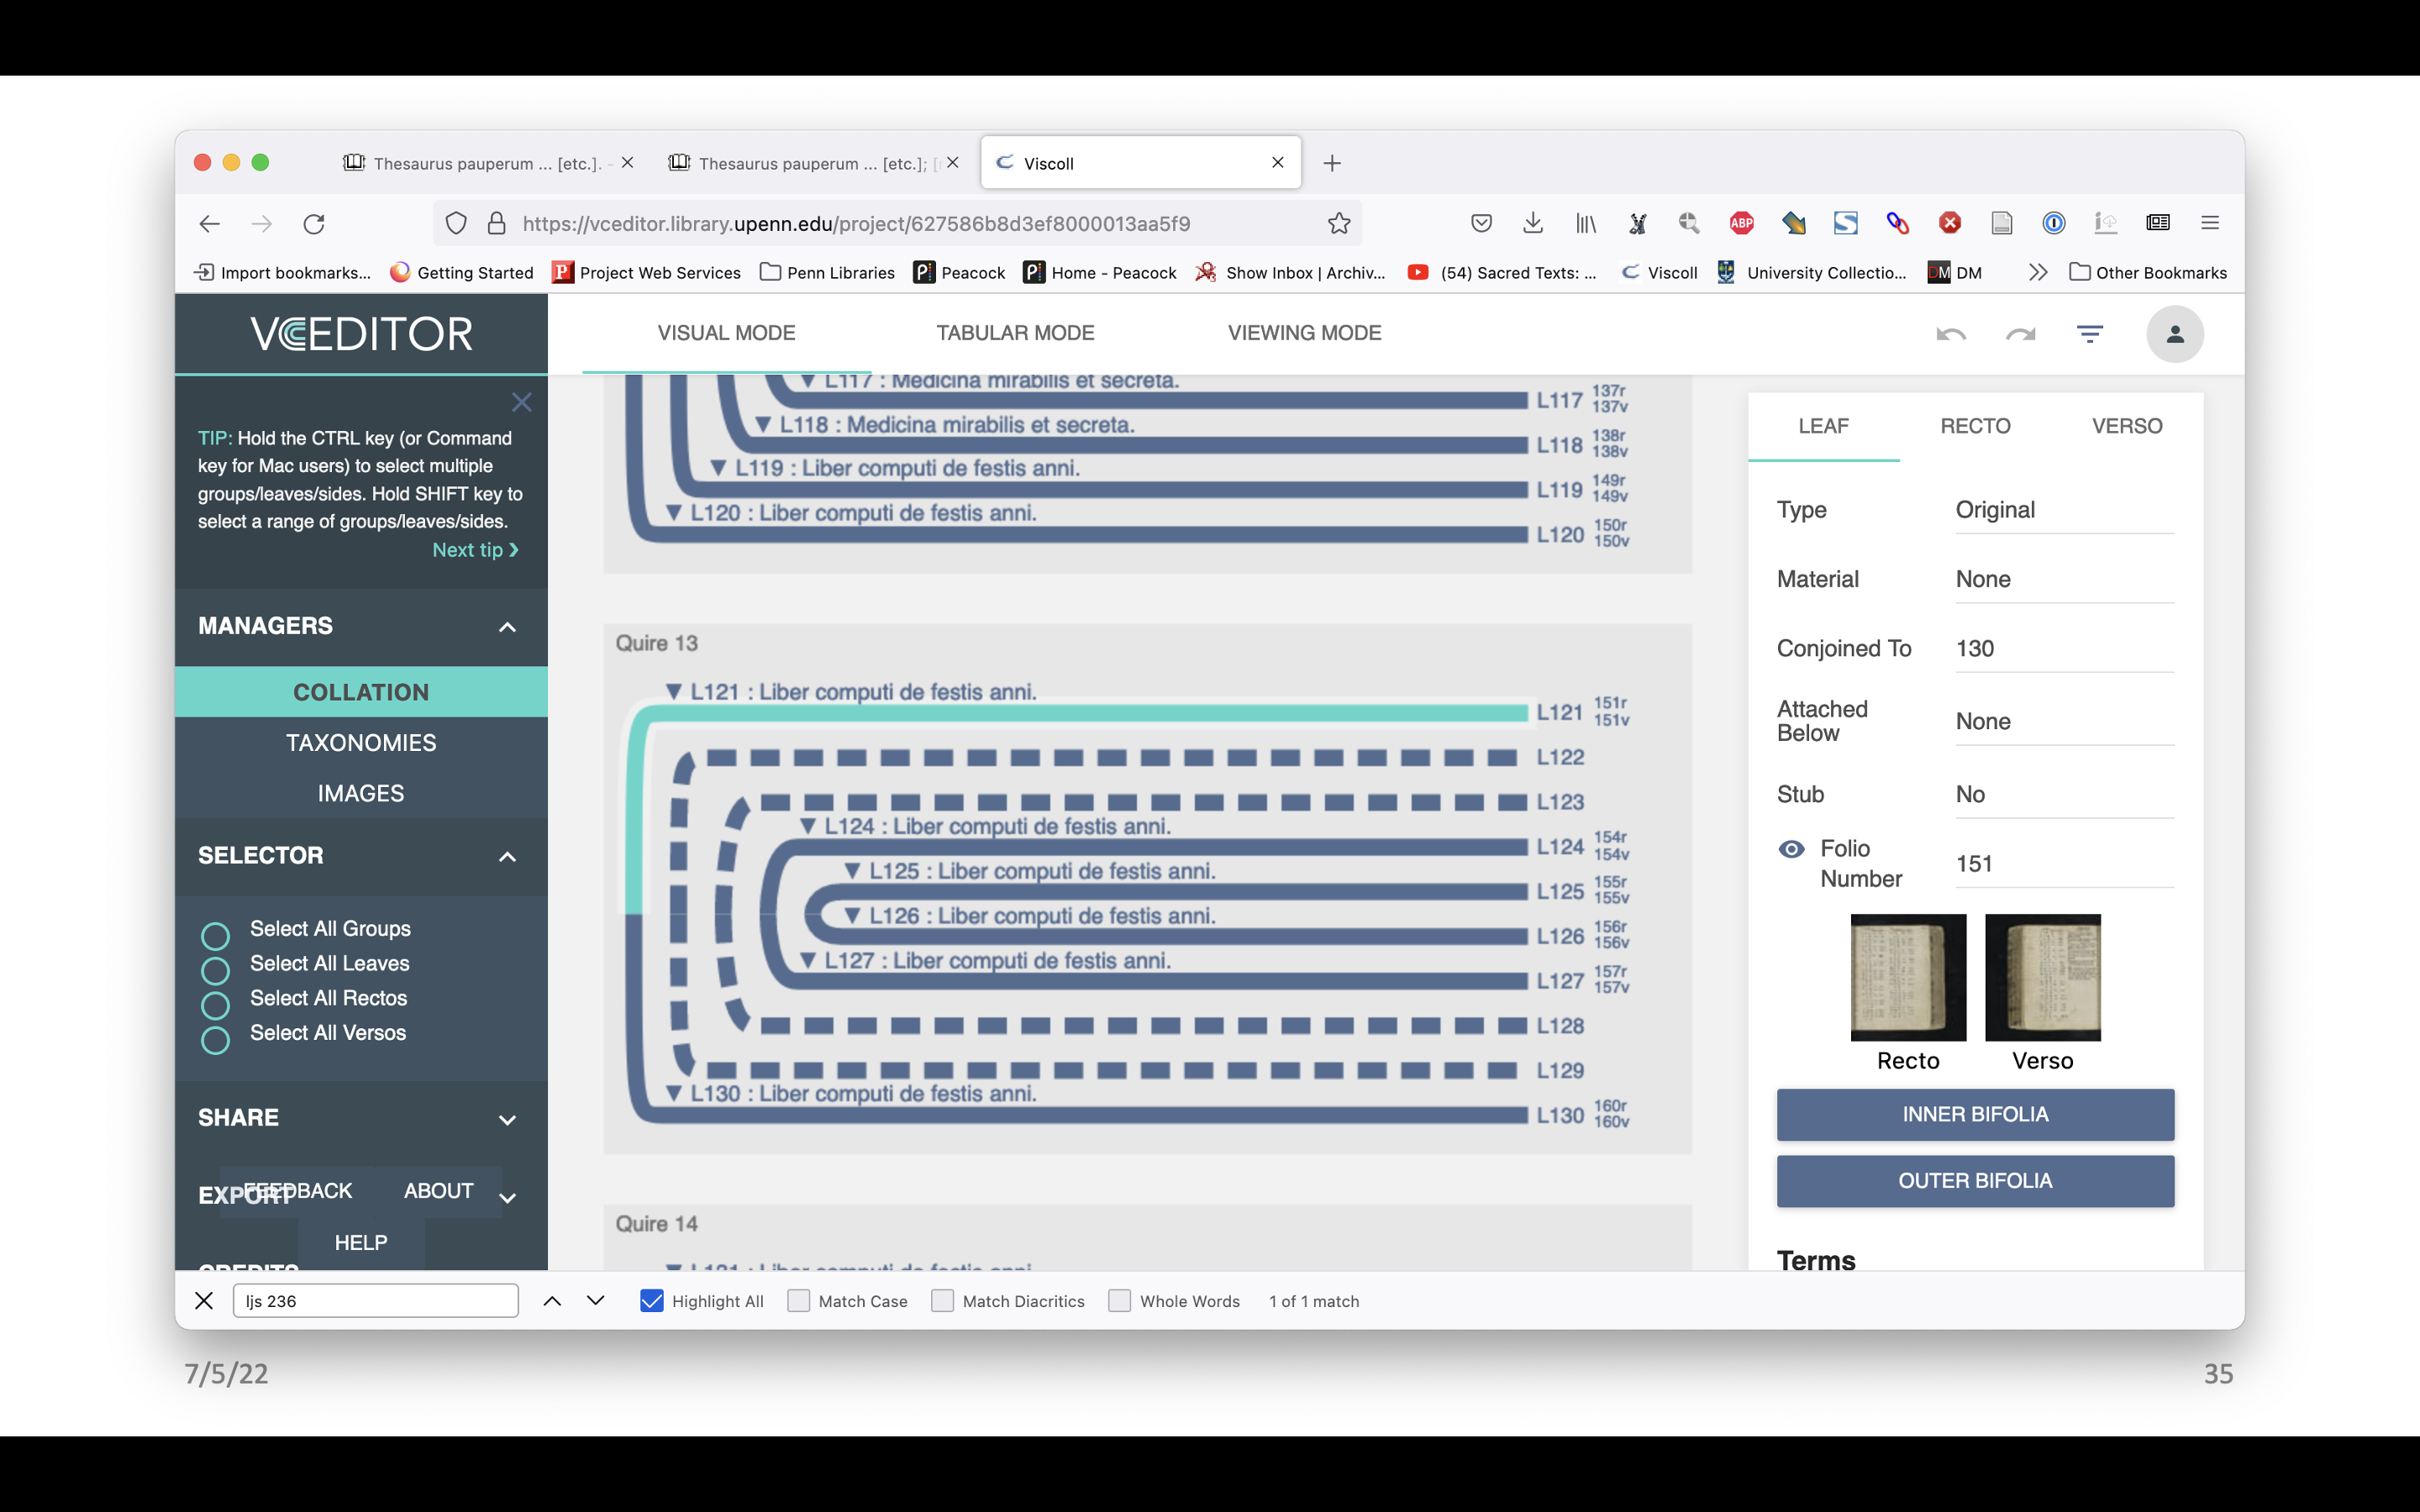
This is what the finished model of LJS 236 looks like in VCEditor. There are missing leaves, for example, and the contents have been mapped to the diagram.
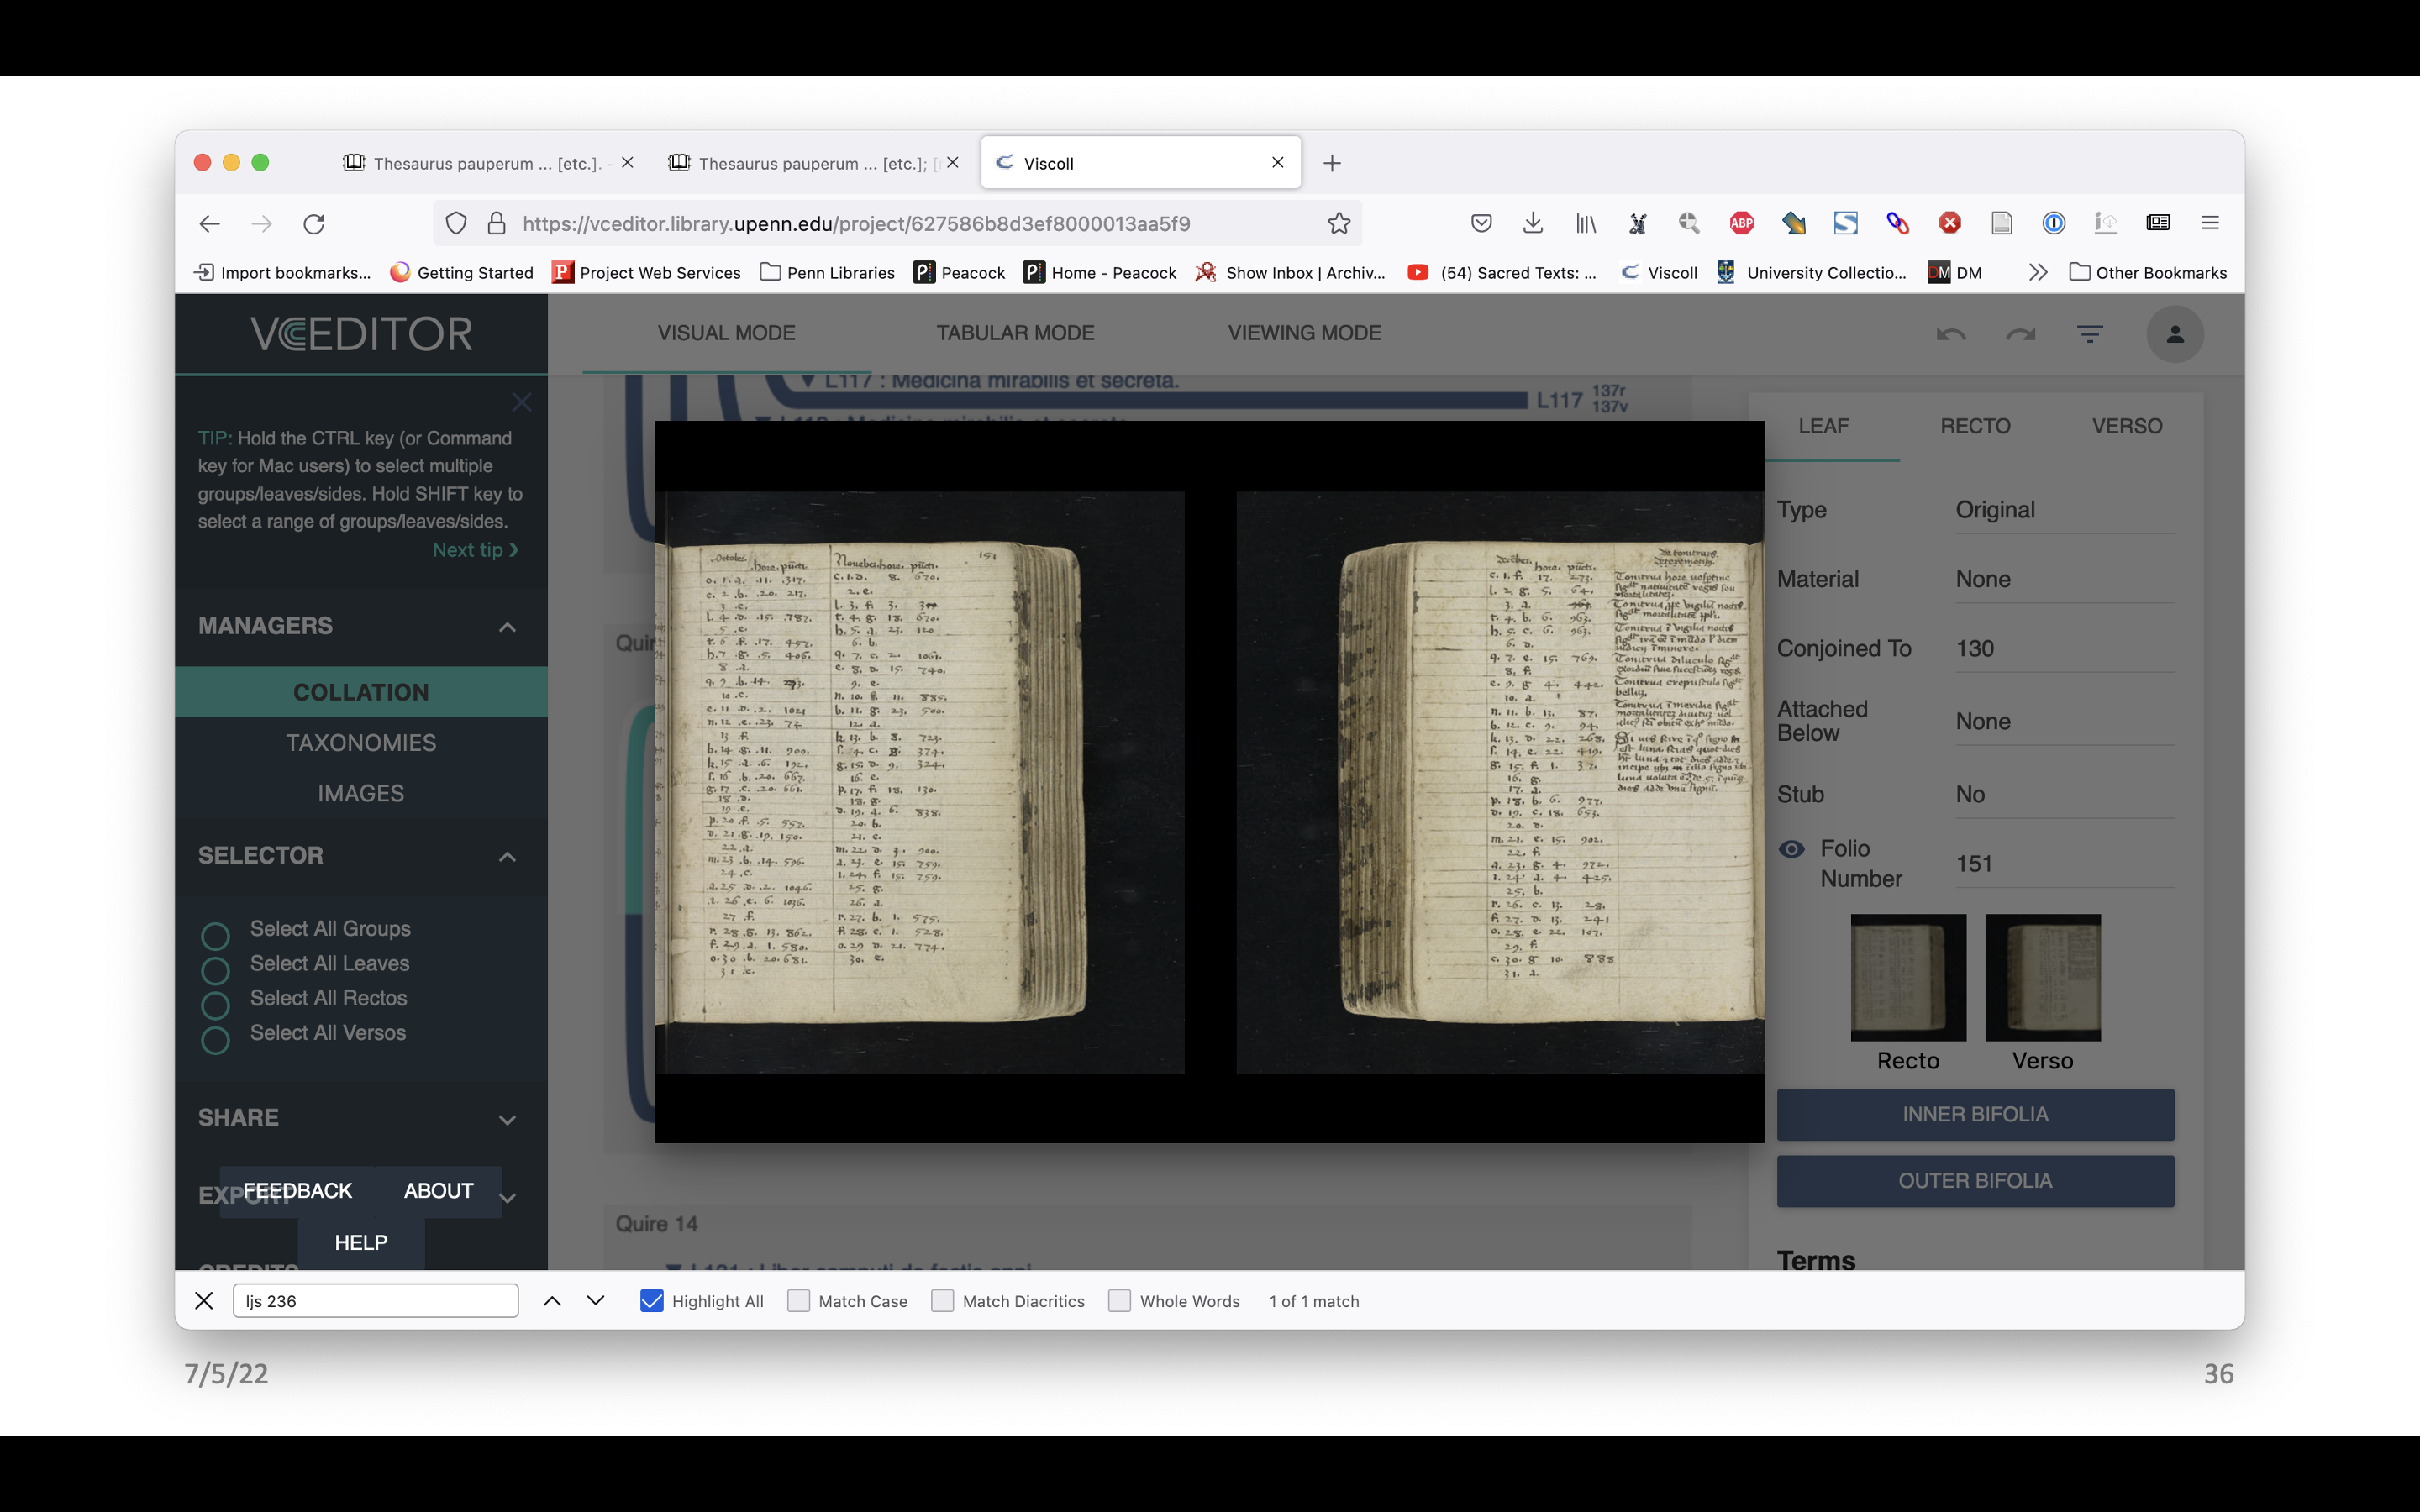
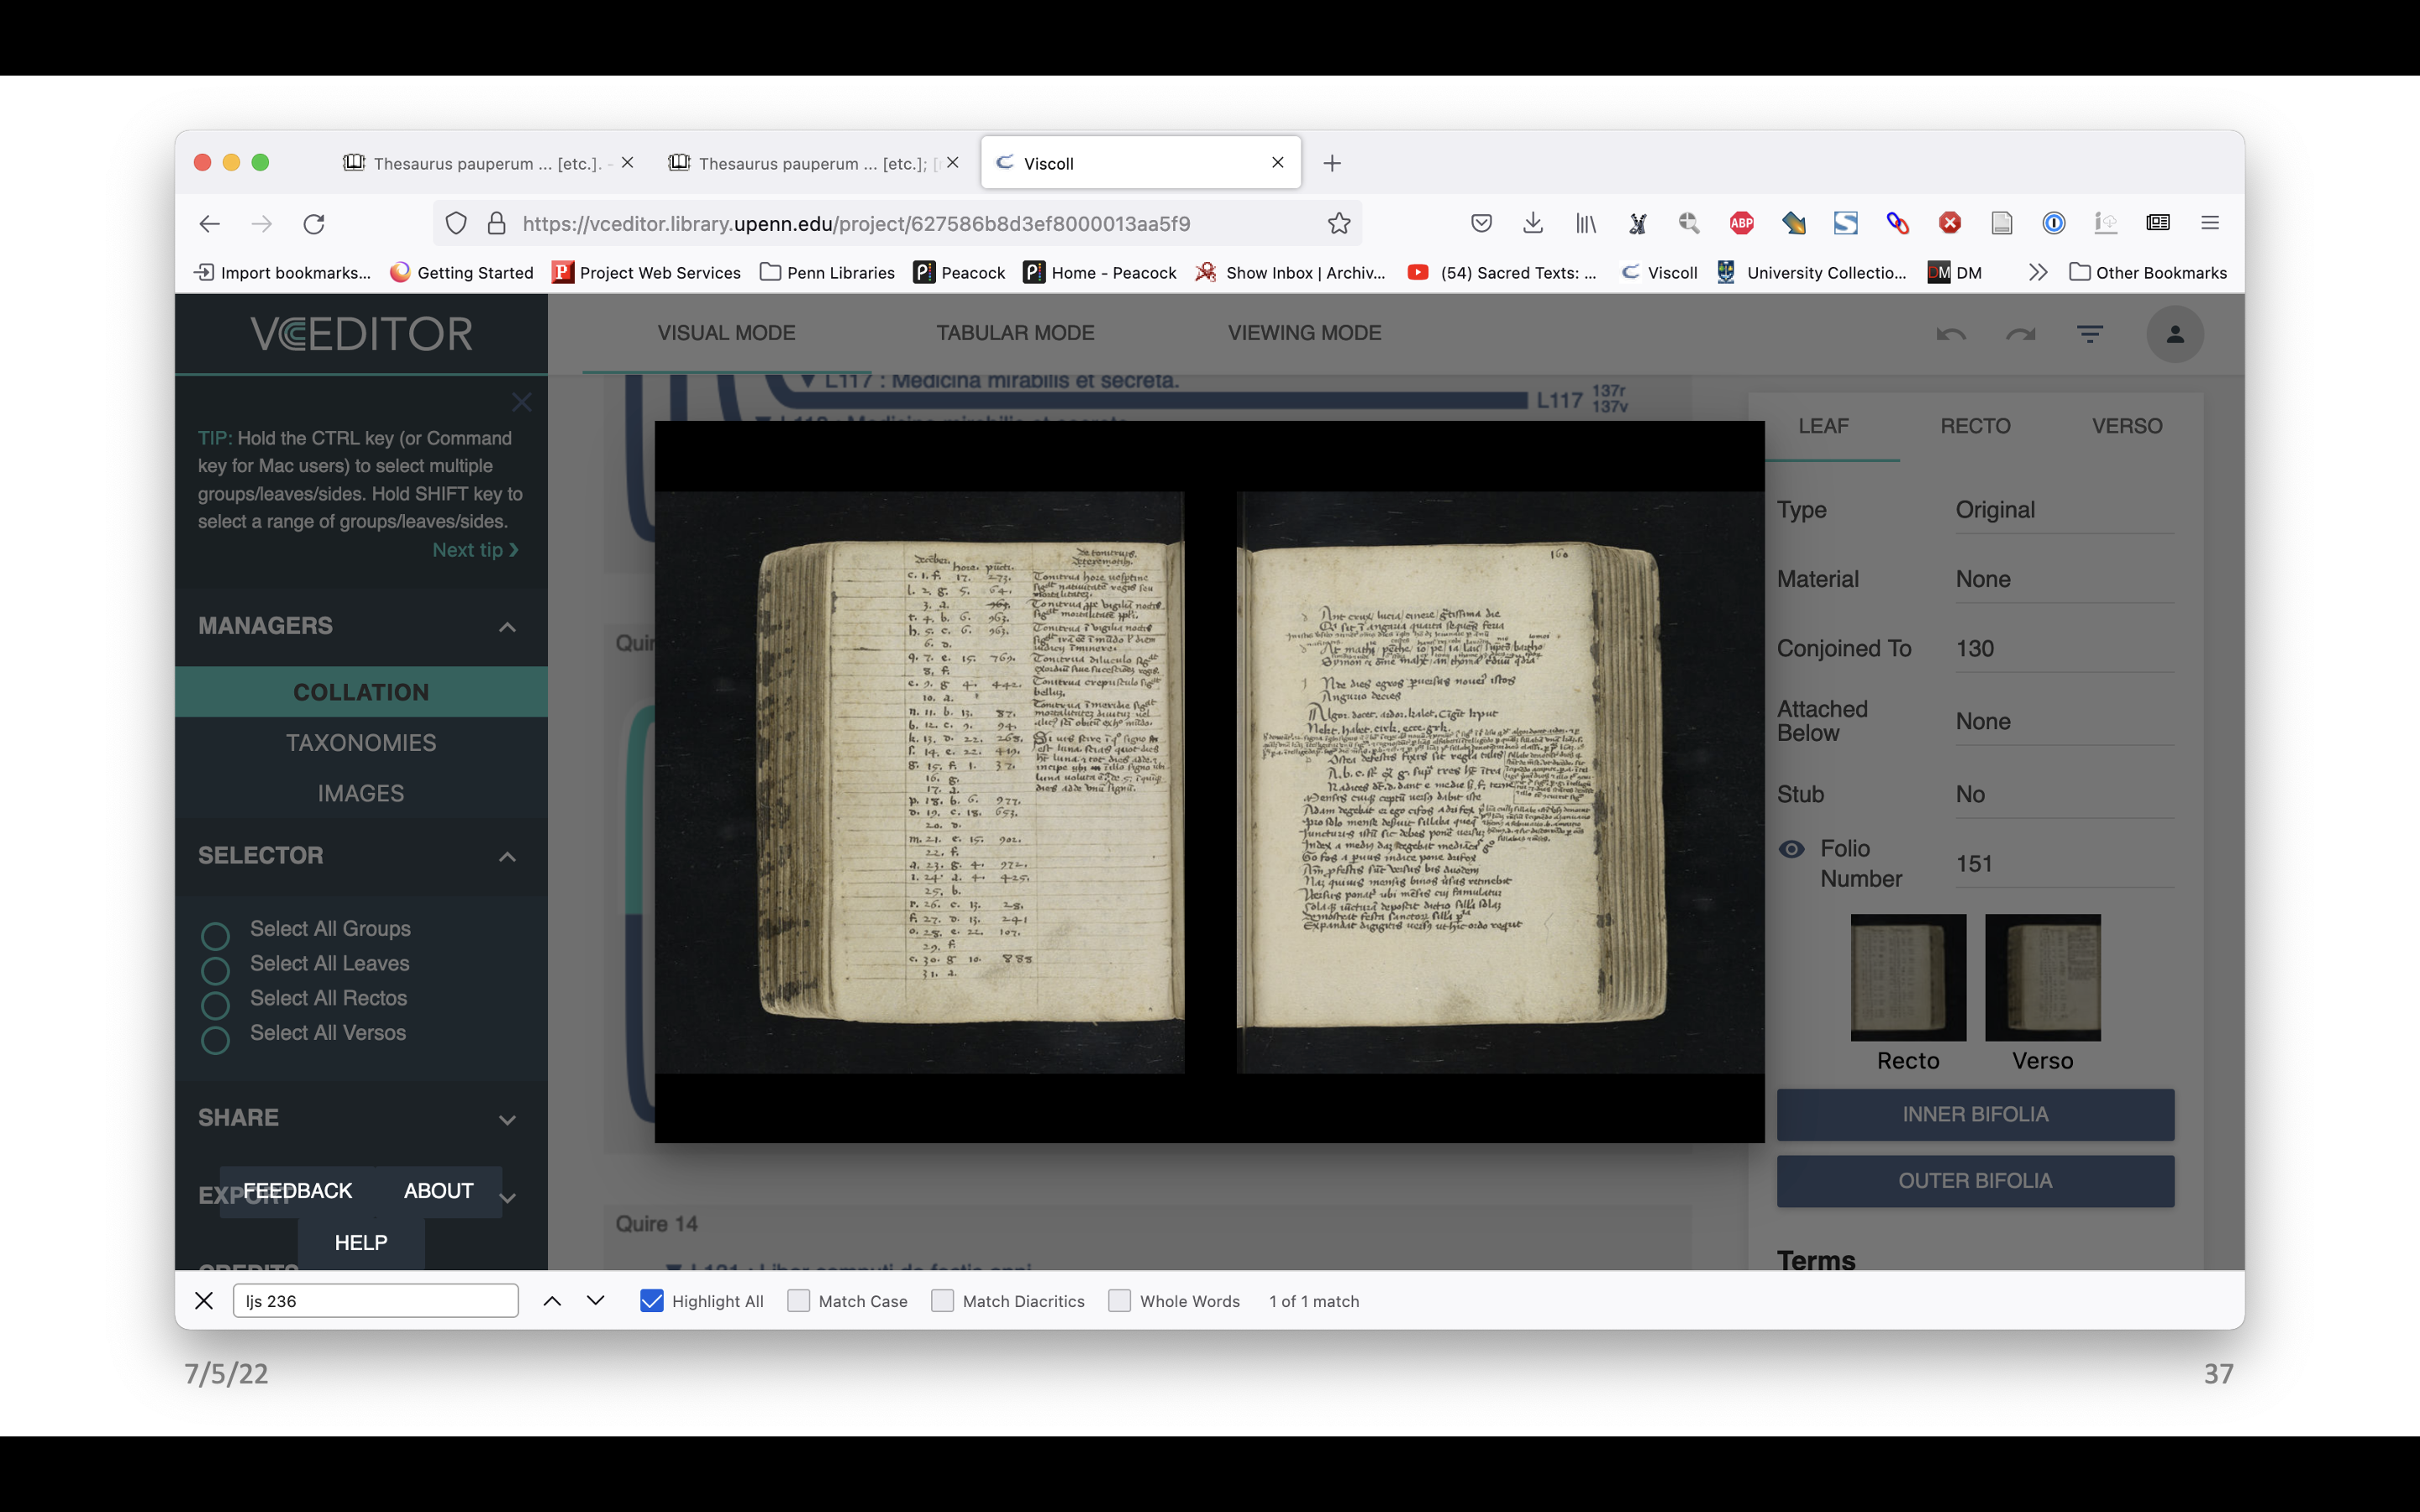
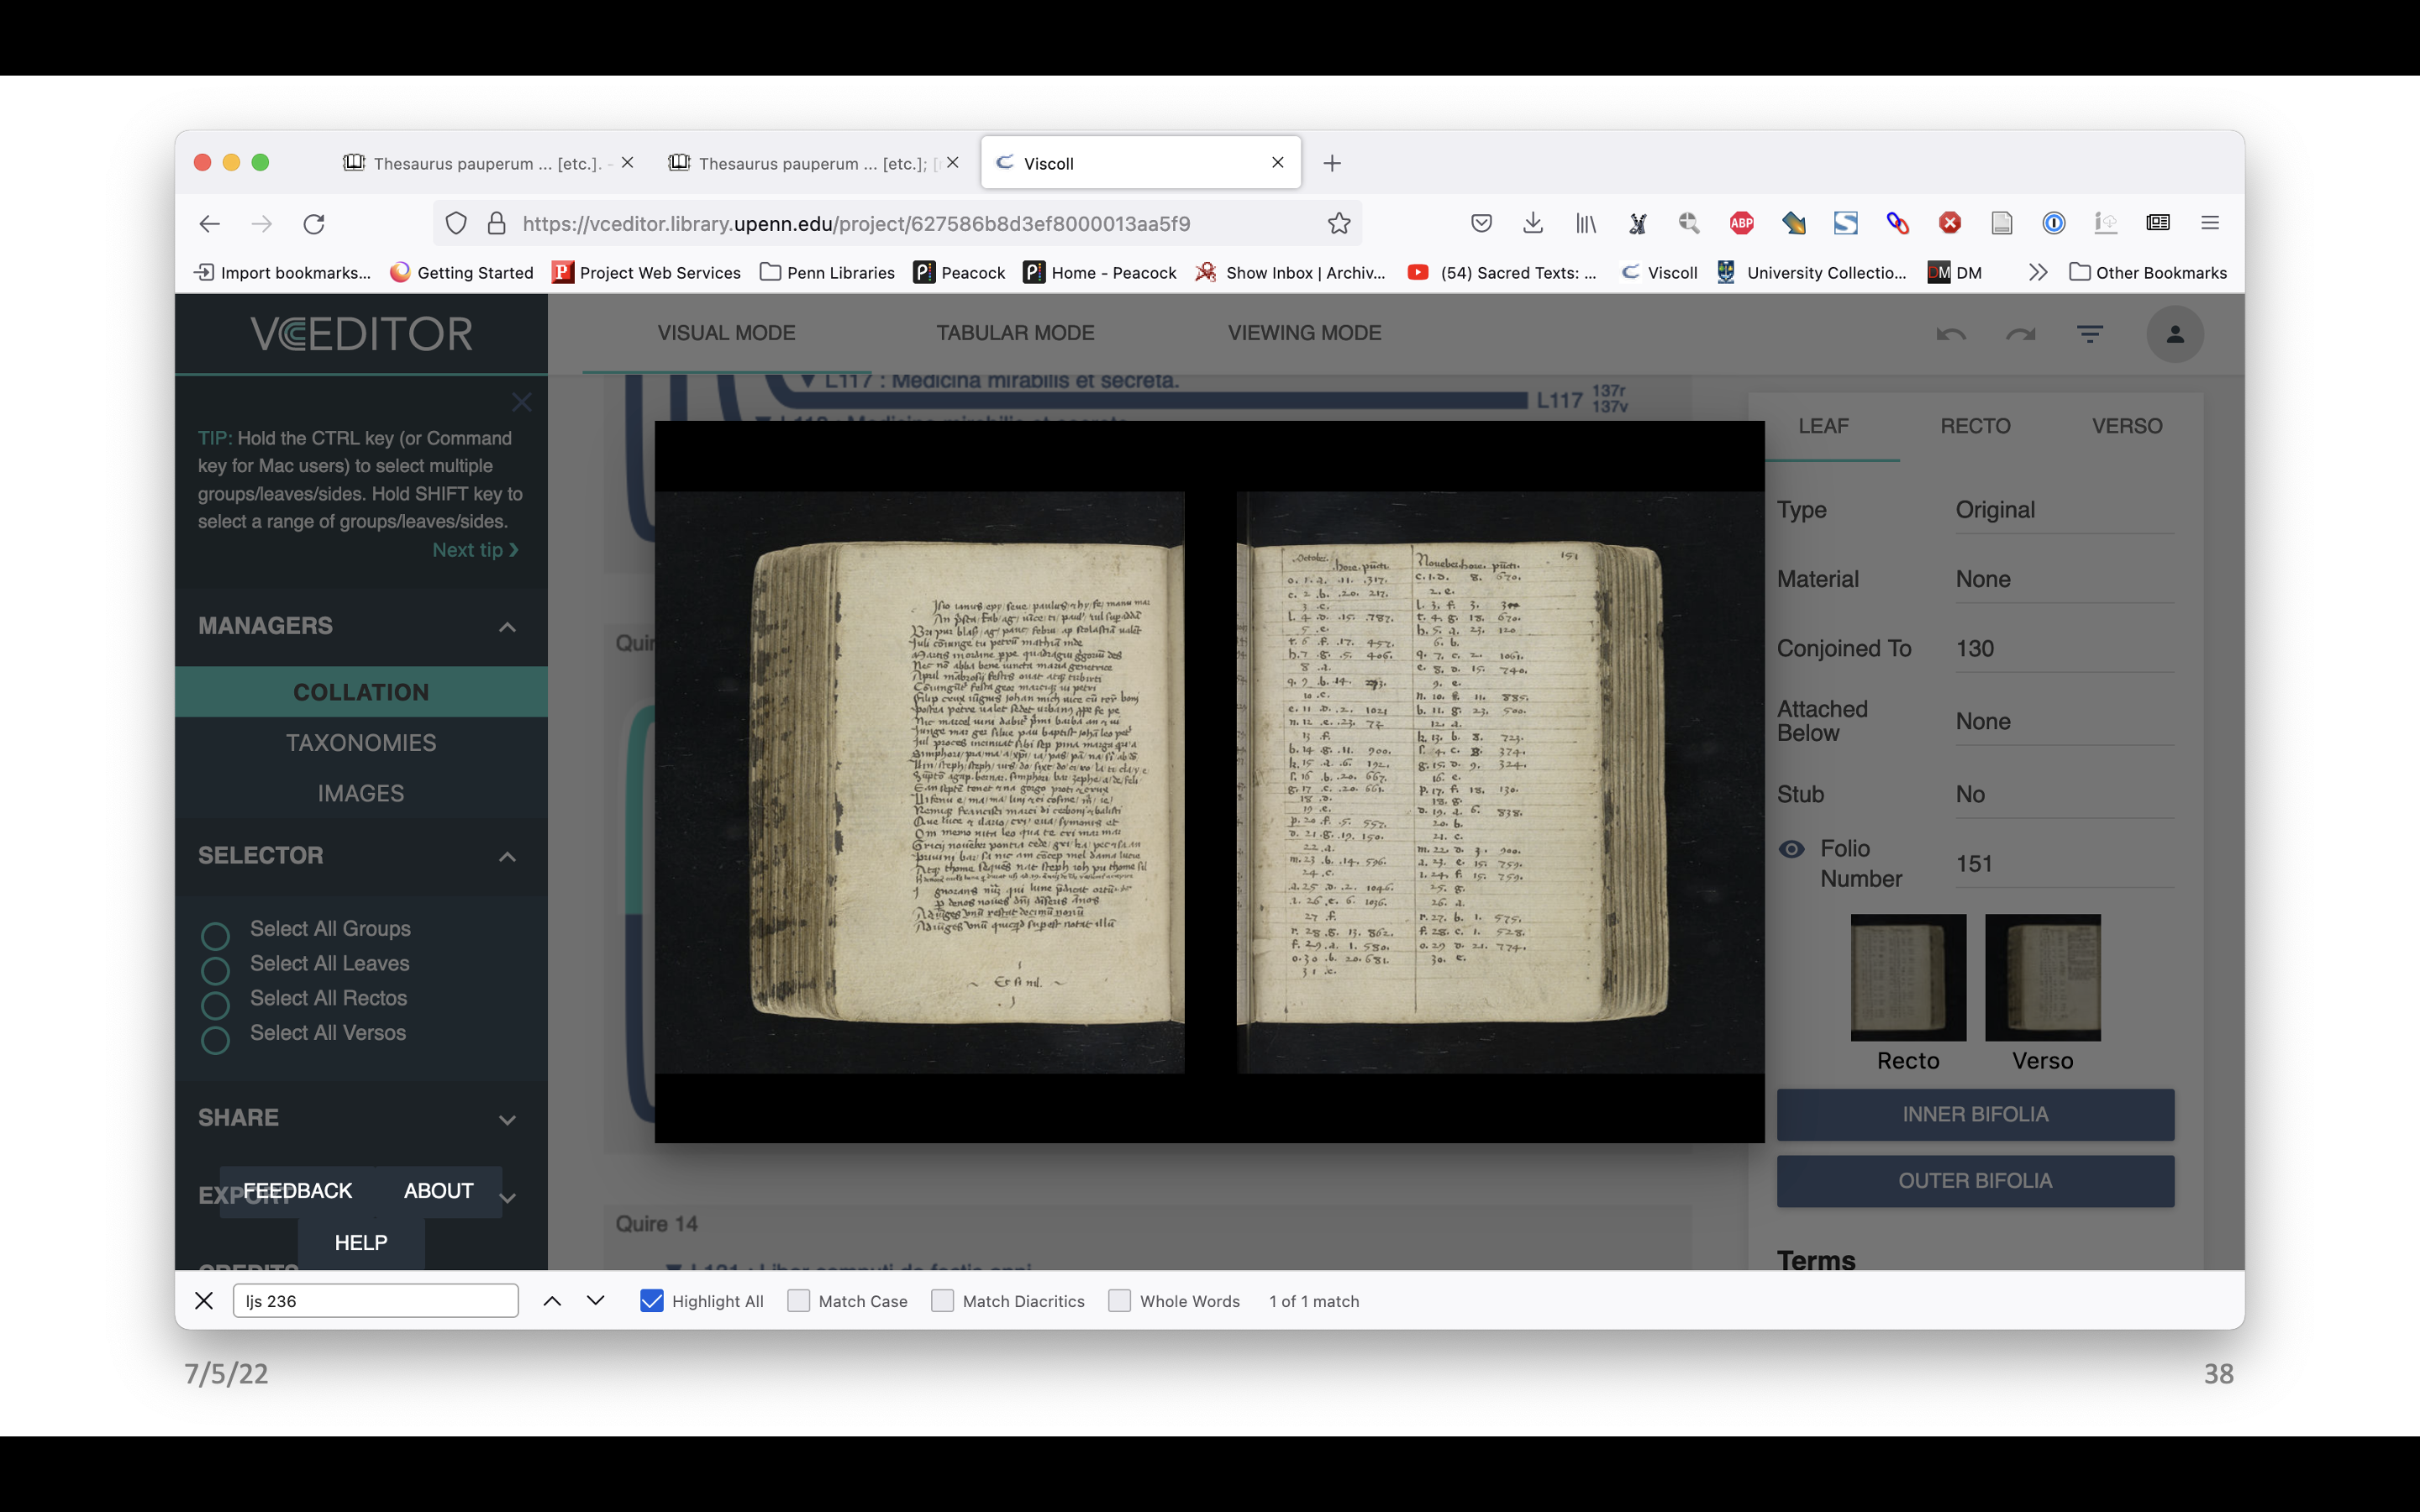
The images have been mapped as well. There are a few different ways one can look at them. There’s the front and the back of the selected leaf, but one can also look at the inner side of the bifolo, and the outer side of it. You can see there’s the catch word at the end. That’s pretty cool.
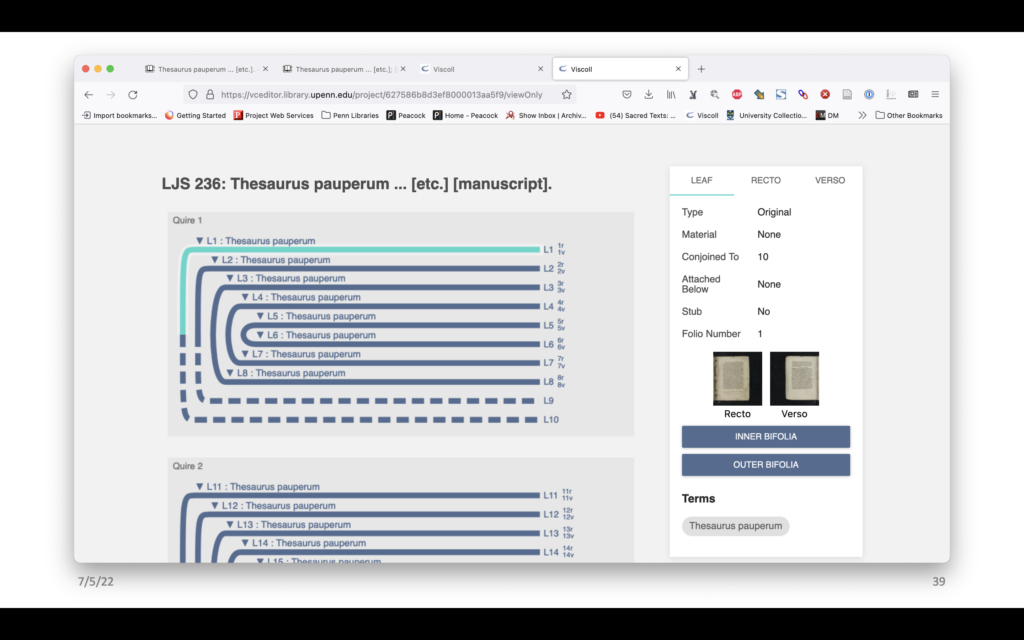
There’s also a view only version so these can be made public and anybody can see them and click through and look at the images, but not edit it. VCEditor also makes many different outputs of the model data, including individual image files, one for each quire, in both PNG and SVG – these are just two different file formats that could be useful for different purposes, and these are designed for people to take and reuse. There is also a PDF file, which is a screenshot of the full model as viewed in VCEditor, and there is a PNG version of that as well.
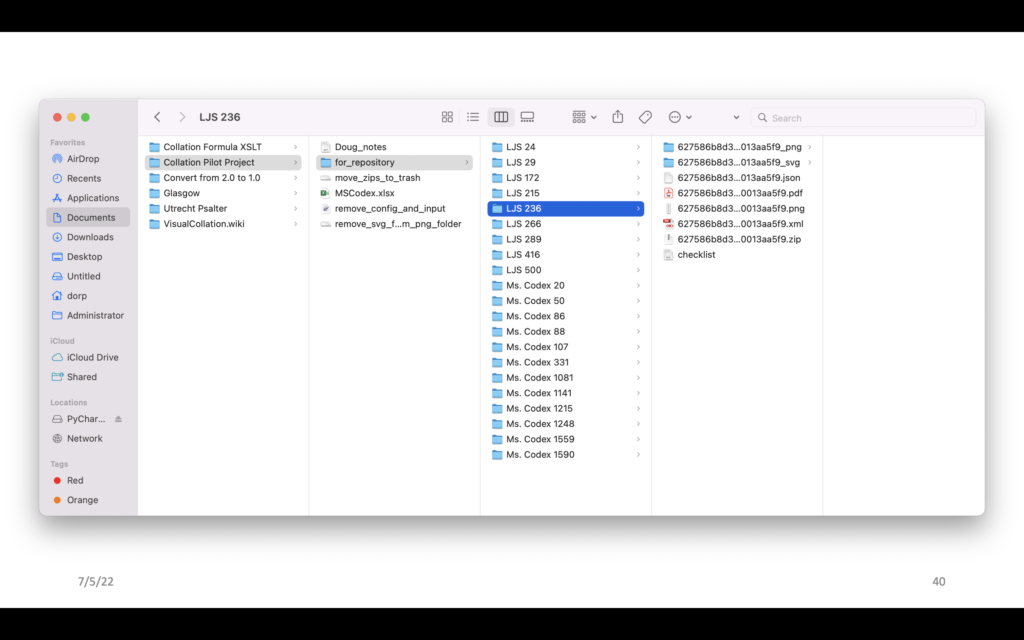
Finally there is an XML file and a JSON file. These are data format files that represent the collation model in two different computer-readable languages. The json file is particularly important because that file can be loaded into the VCEditor. So if you have a JSON file for a manuscript, then you can upload it into VCEditor and then you can edit it, which could be useful if you’re doing research on a manuscript there is an error, or if you want to add information.
Right, so let’s bring this together. We have a collation model built in VCEditor and we have all of these files exported from VCEditor. We have the Colenda Repository, which serves manuscript images using IIIF. And then we have Franklin.
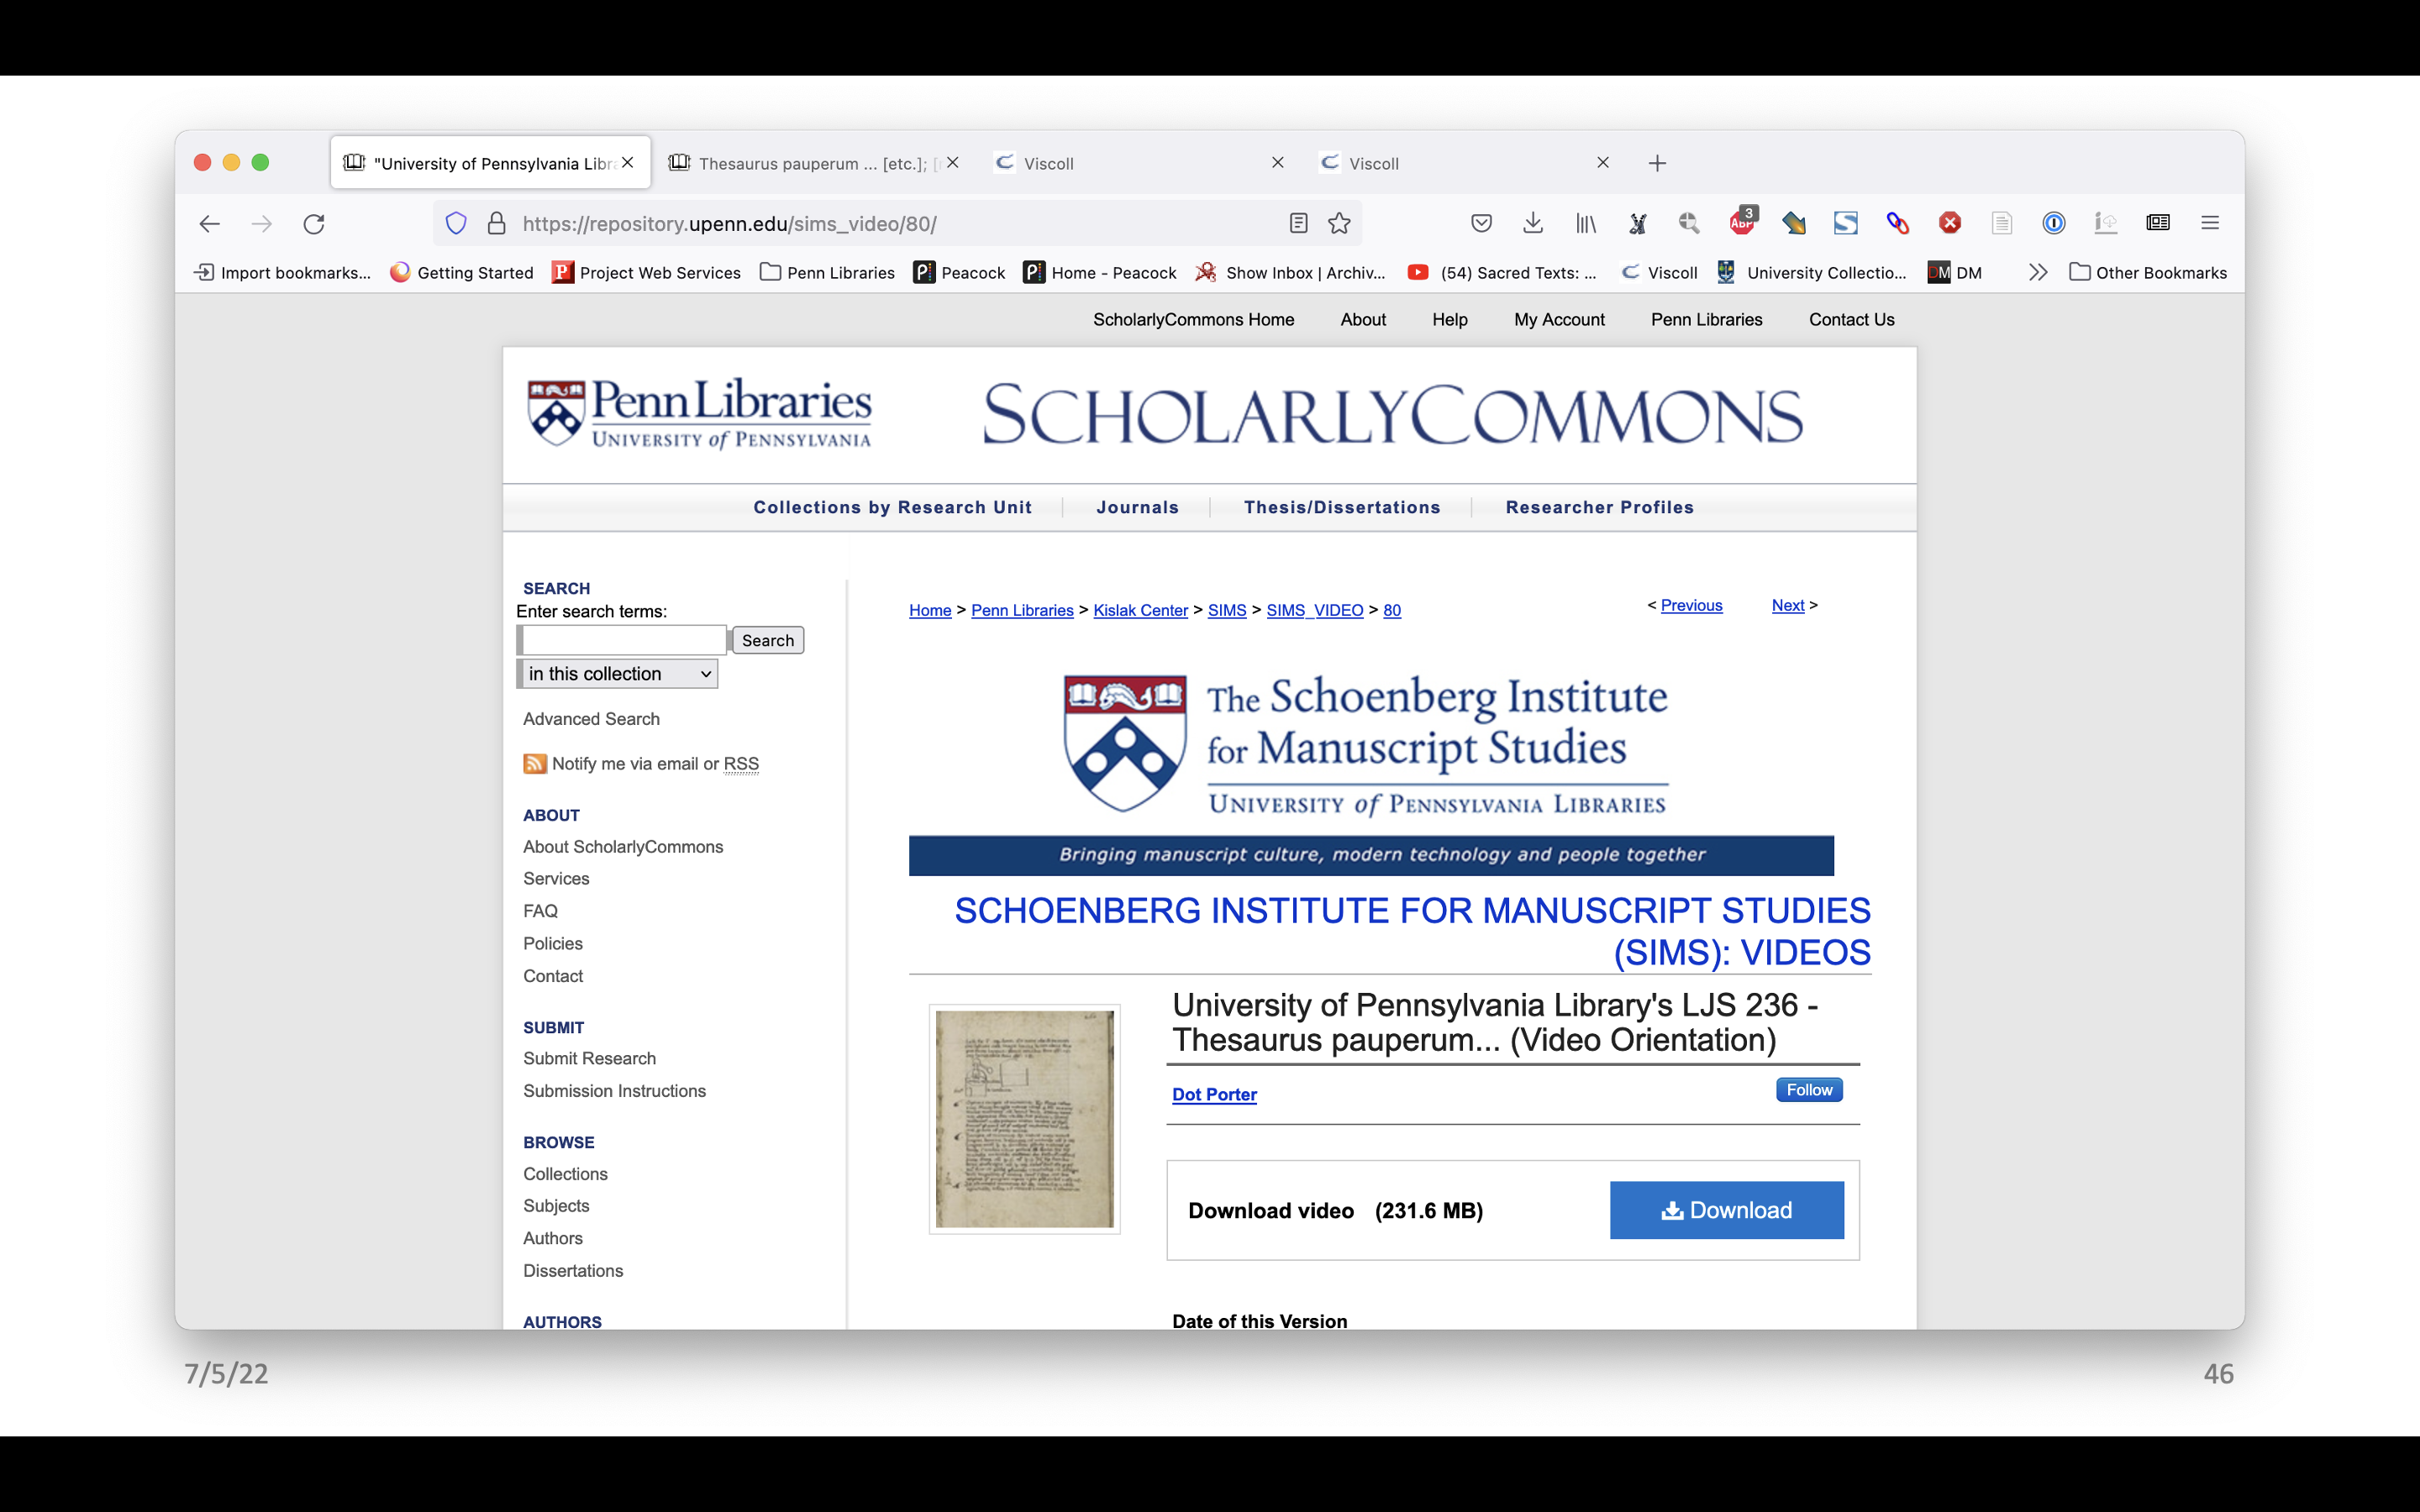
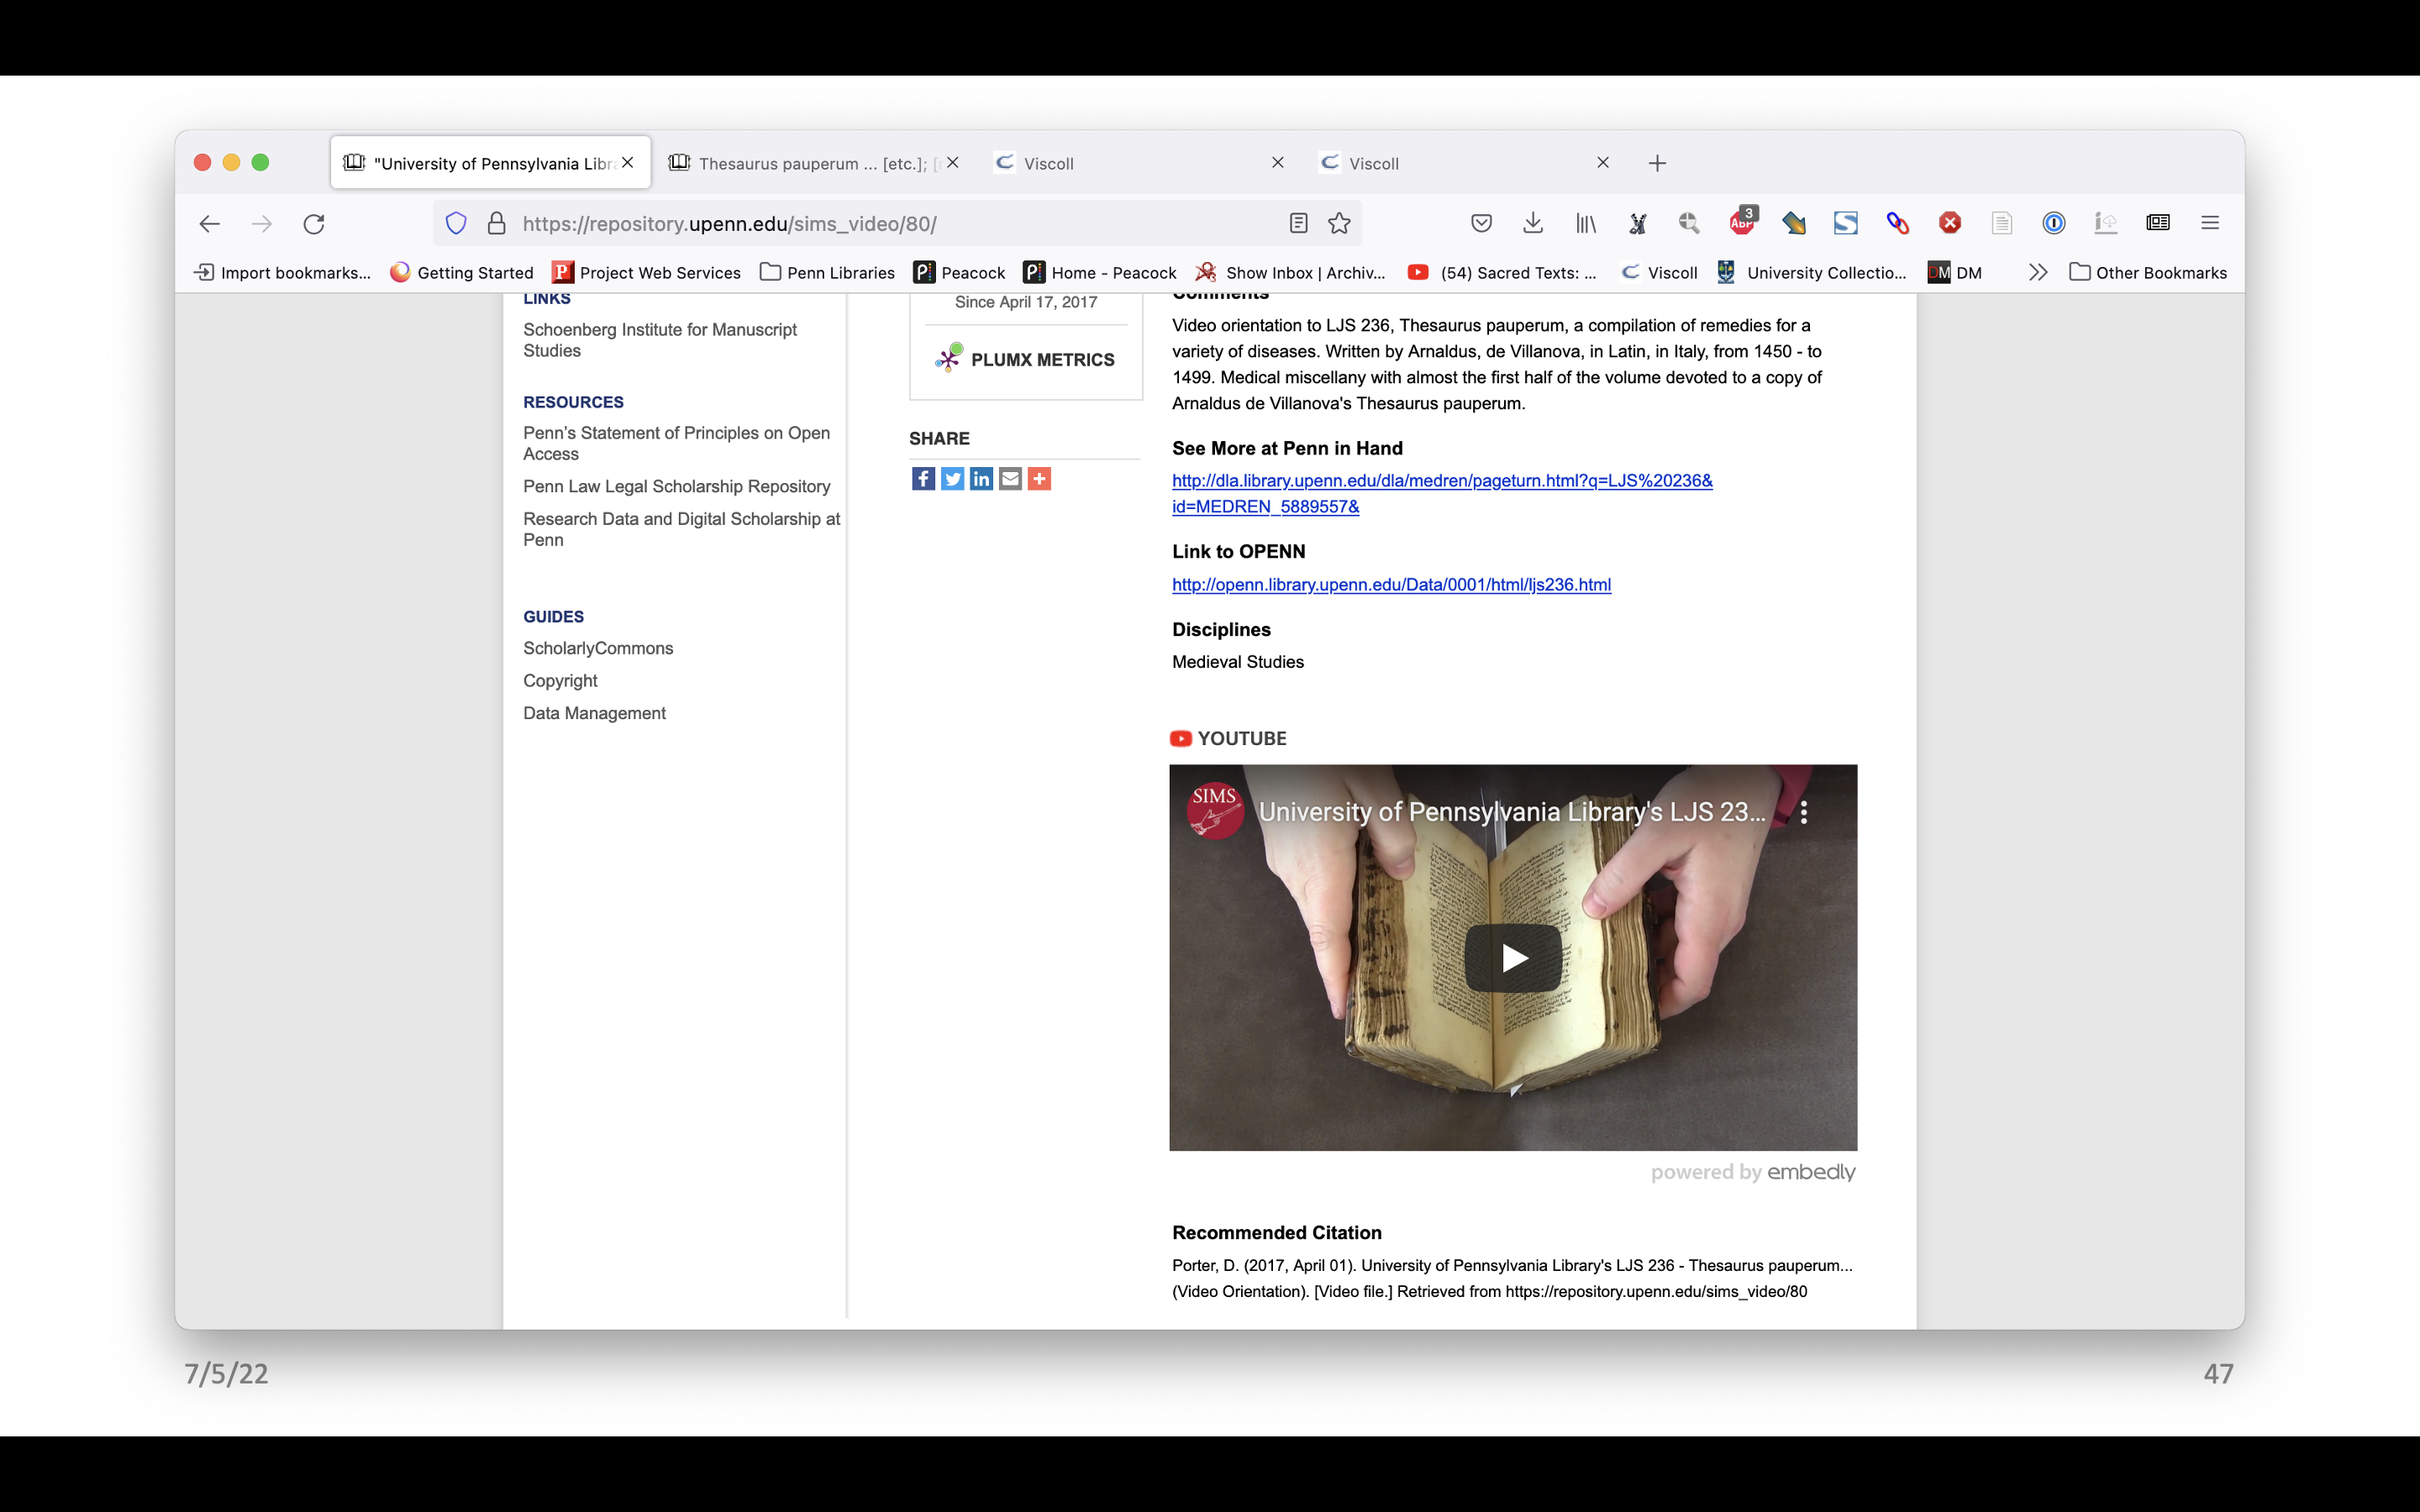
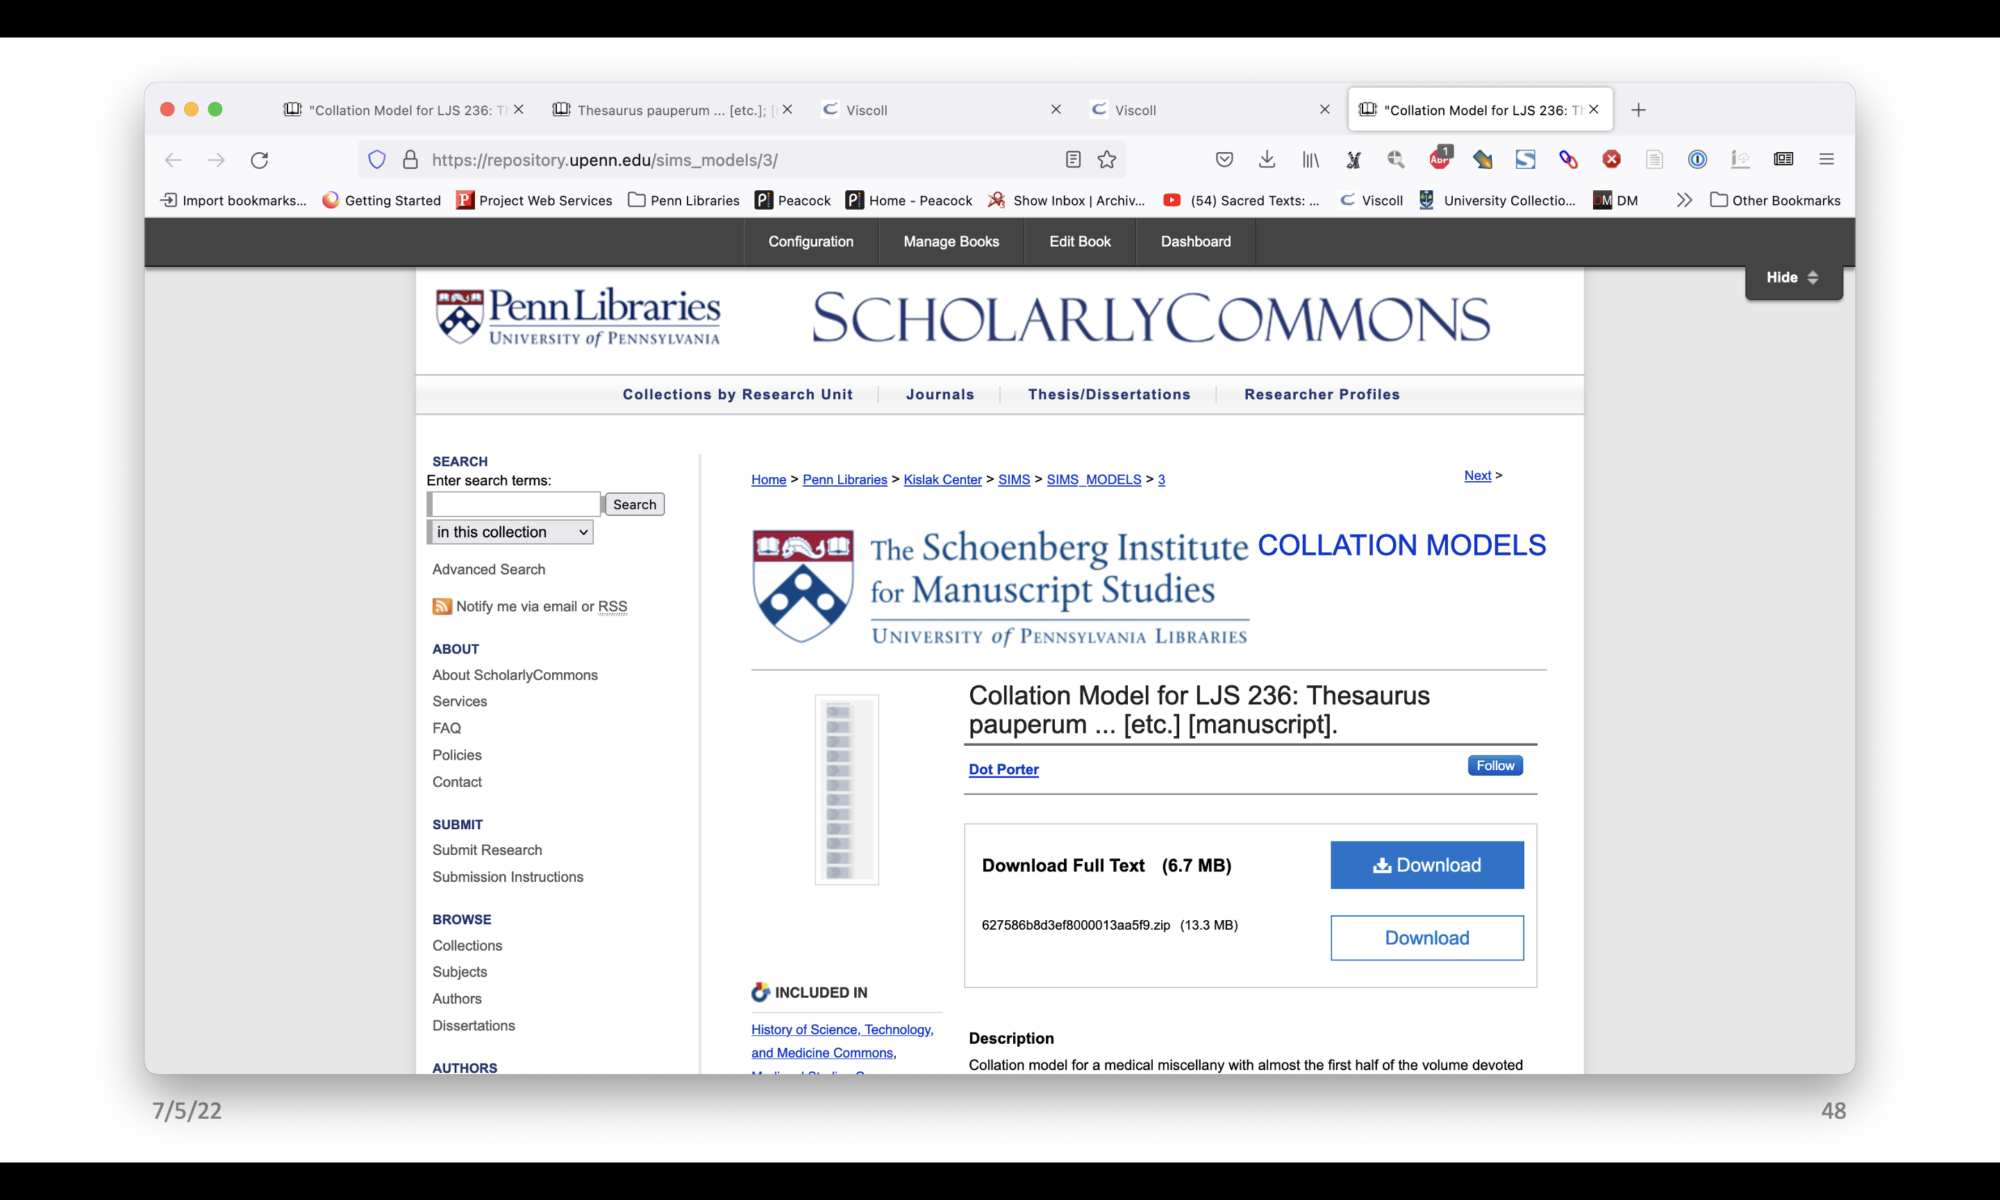
Along with links to facsimiles in Franklin, there is a link to a video orientation. This link takes us to a record in our institutional repository, ScholarlyCommons. From here one can download the video or watch the video embedded from YouTube. There is a Video Orientation playlist on YouTube, so one could also watch them there. But the important thing is that if YouTube goes away, the video would still be here, in the repository, and someone could still watch it.
For the pilot project we decided to take a similar approach – to store the data in ScholarlyCommons and then link from Franklin to the repository, instead of modifying the interface. We have set up a new collection in ScholarlyCommons, although we don’t have links yet to the records. This is part of the pilot project that is yet to come.
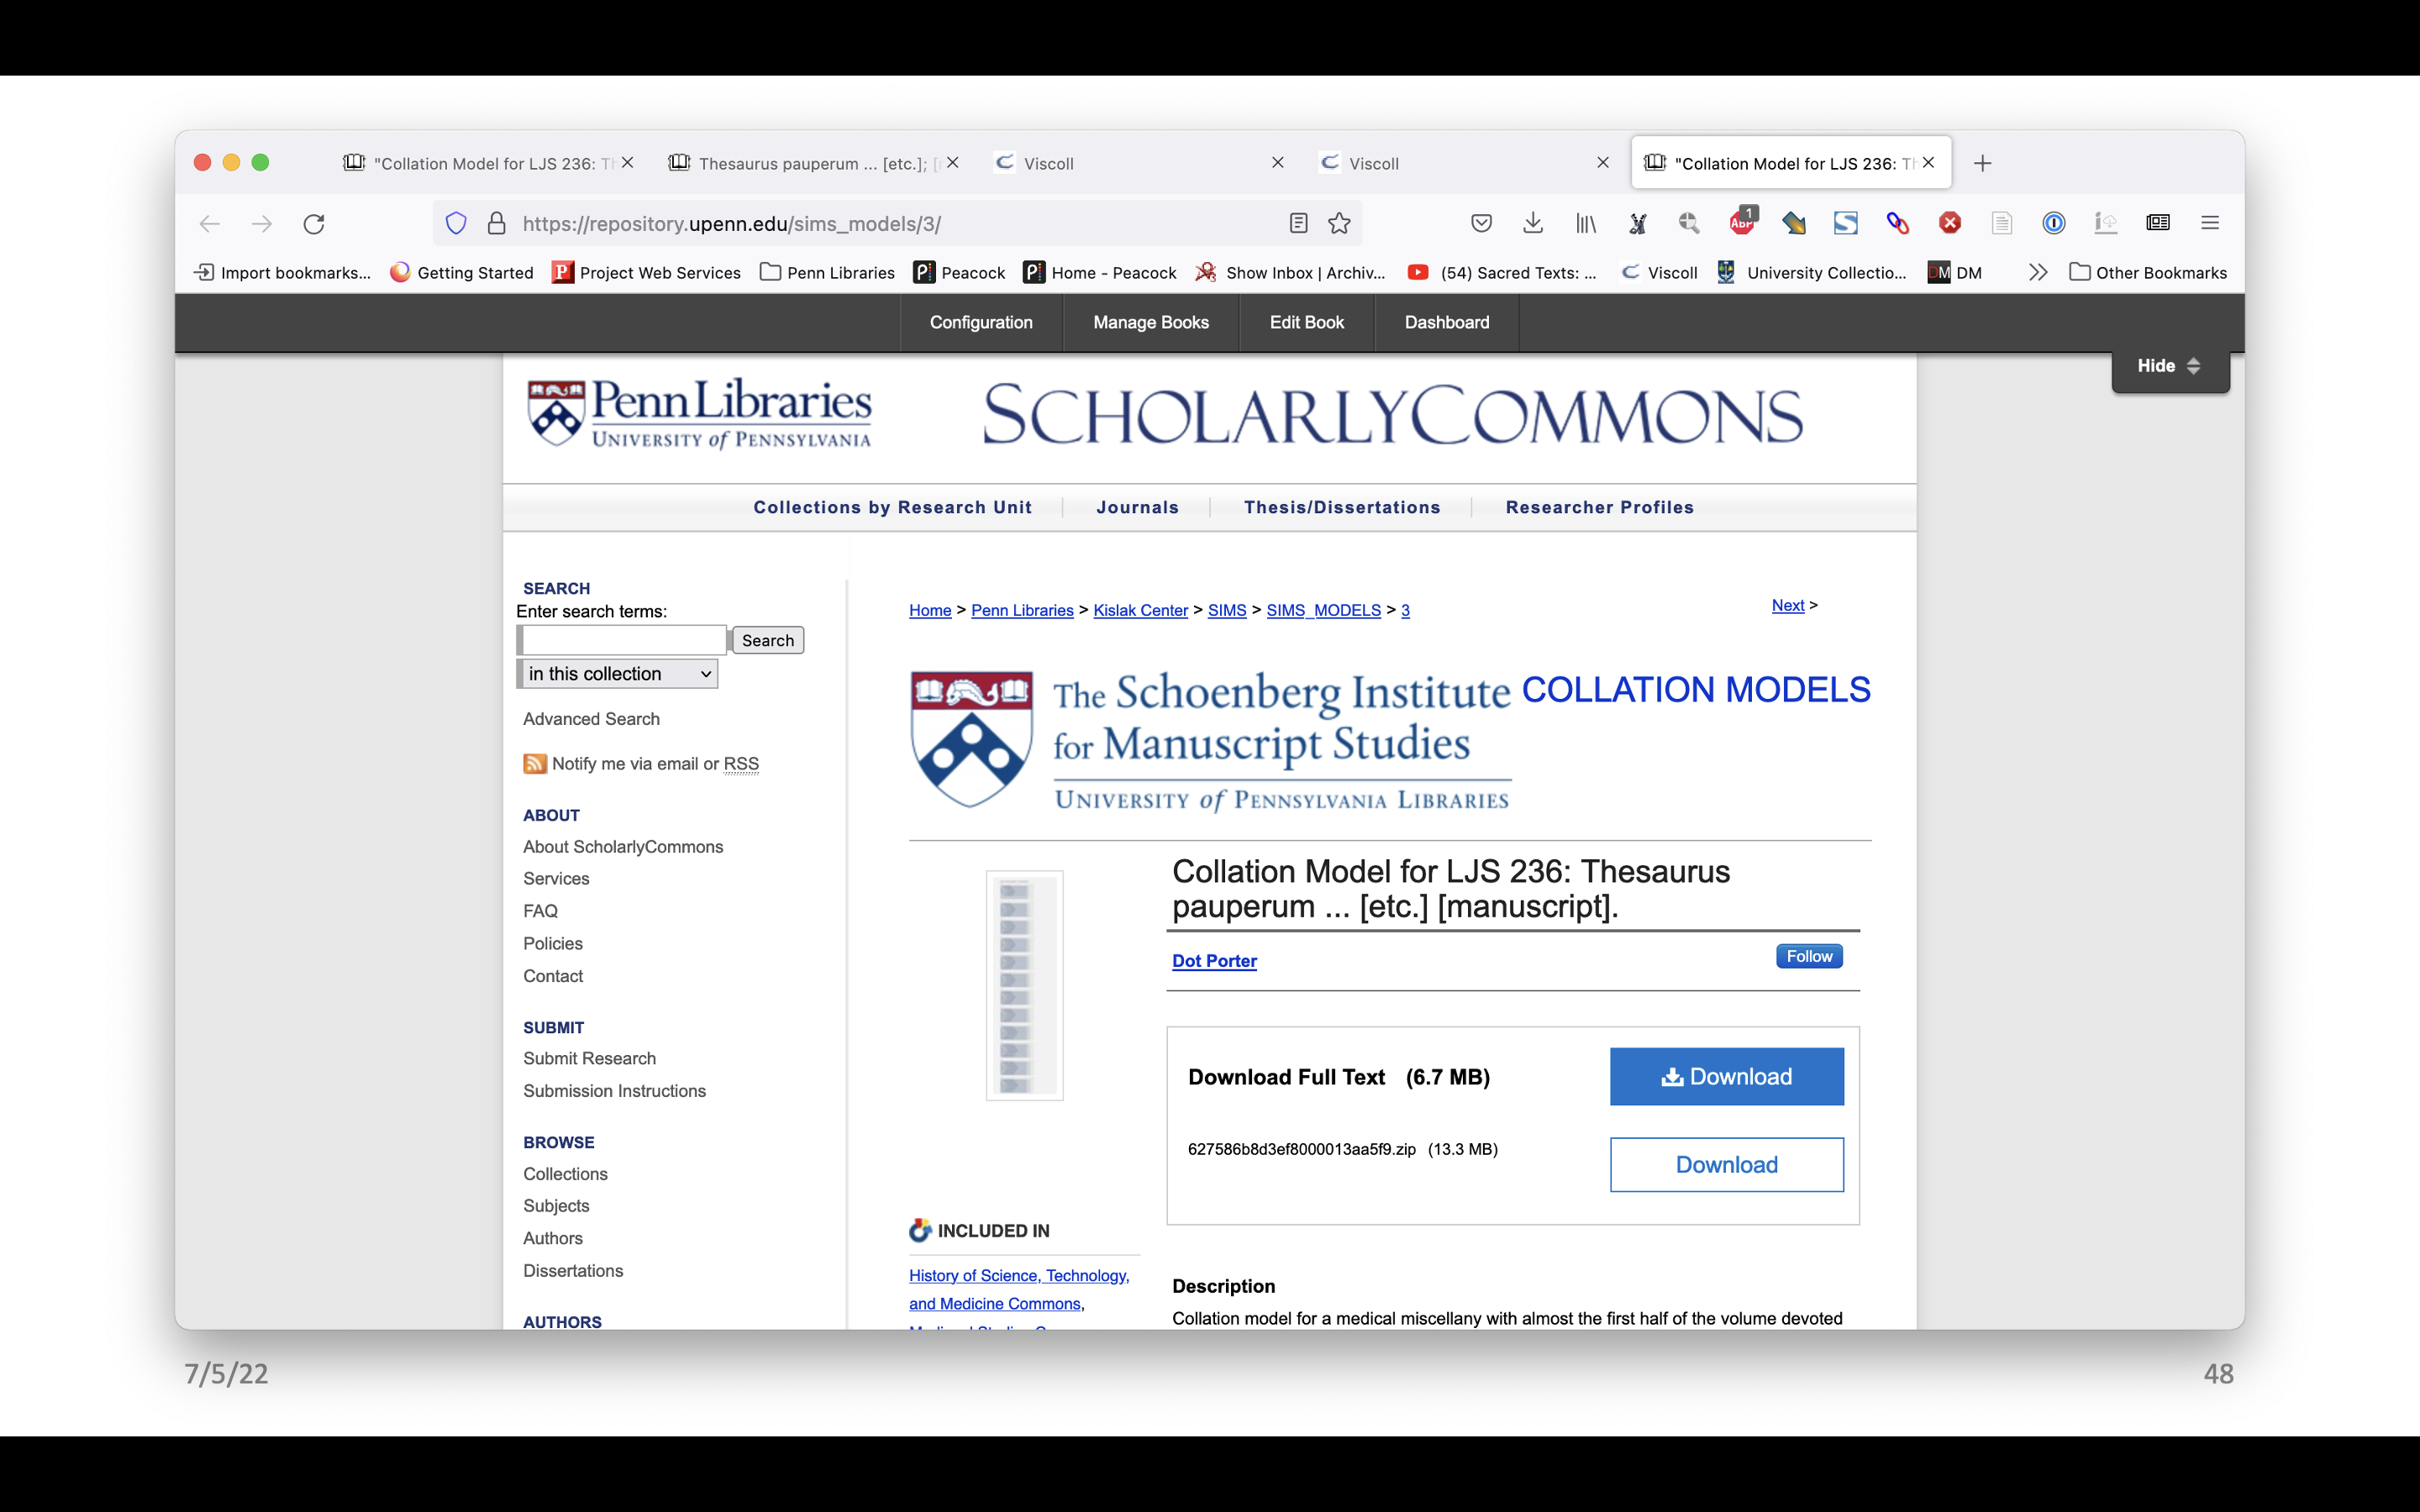
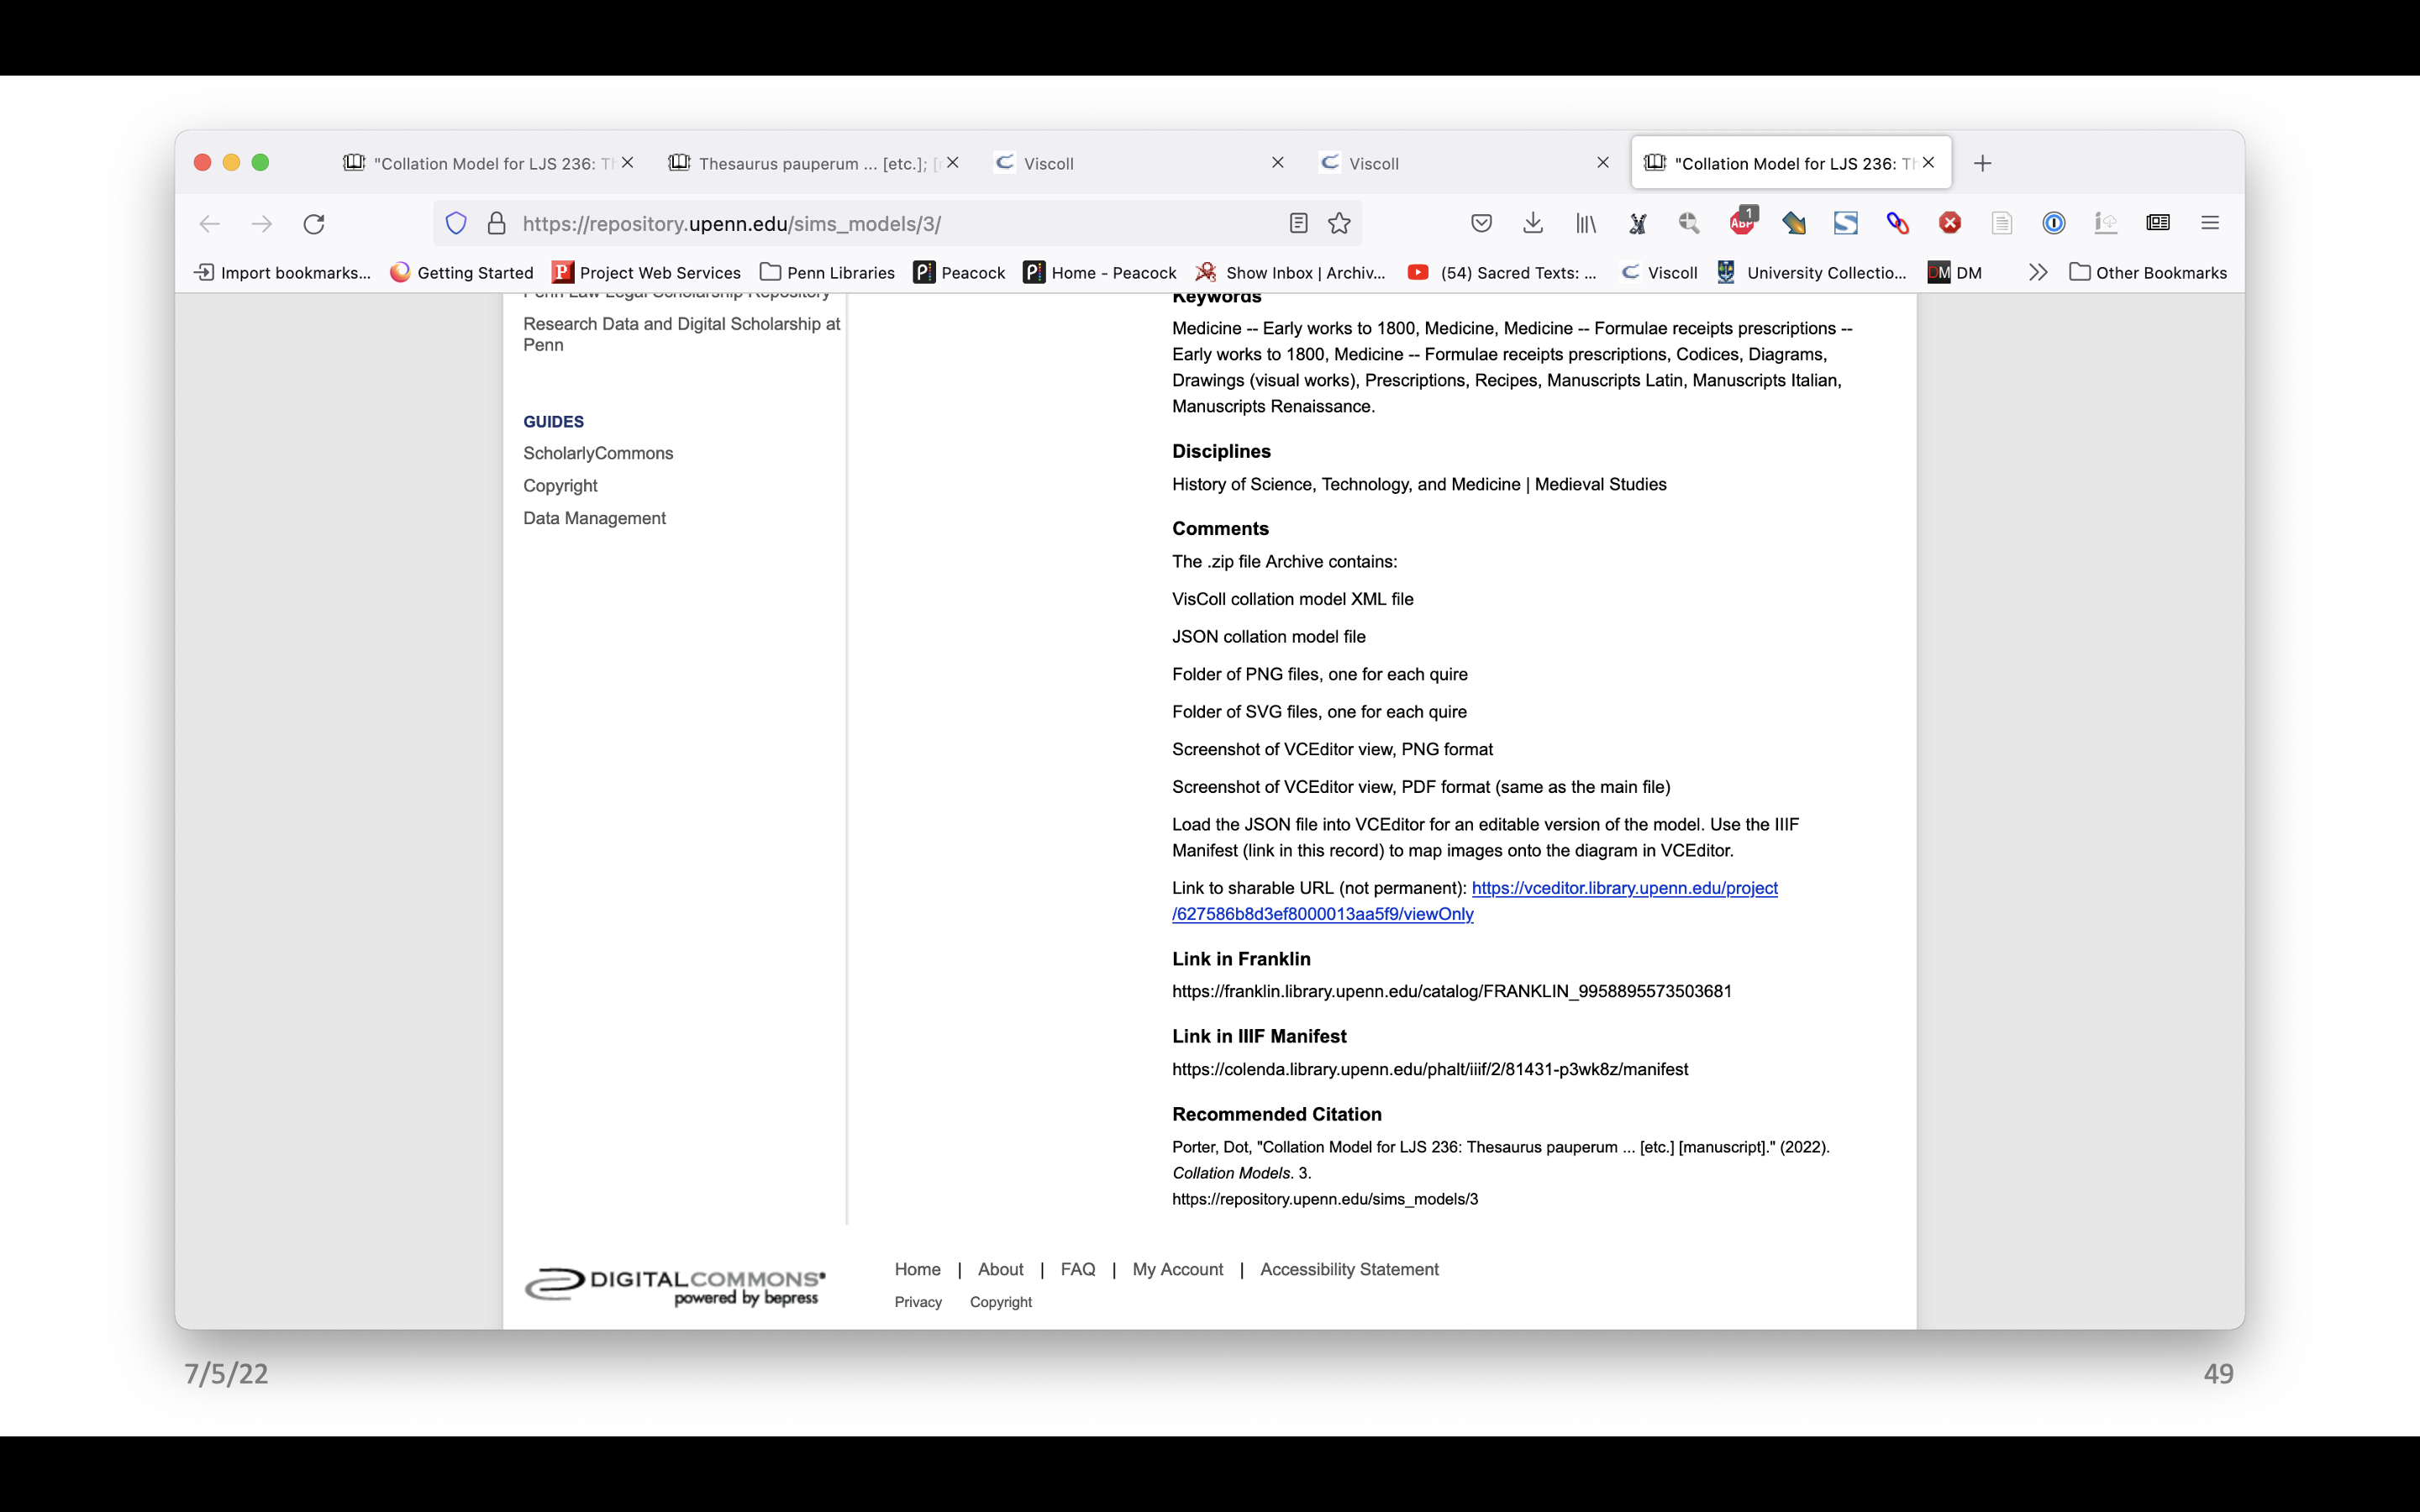
Here yet again we have a record for LJS 236. “Download Full Text” will download a PDF of the screenshot of VCEditor. Below that is a zip file that has everything in it. We scroll down, there’s a description of the manuscript and keywords, but then there is a comment section that lists all the files contained in the zip file along with brief instructions for how to load the JSON file and the IIIF manifest into VCEditor. There is also a link to the view only version in VCEditor. That may not always be there so we can’t depend on it to persist, but it’s a good thing to include for now.
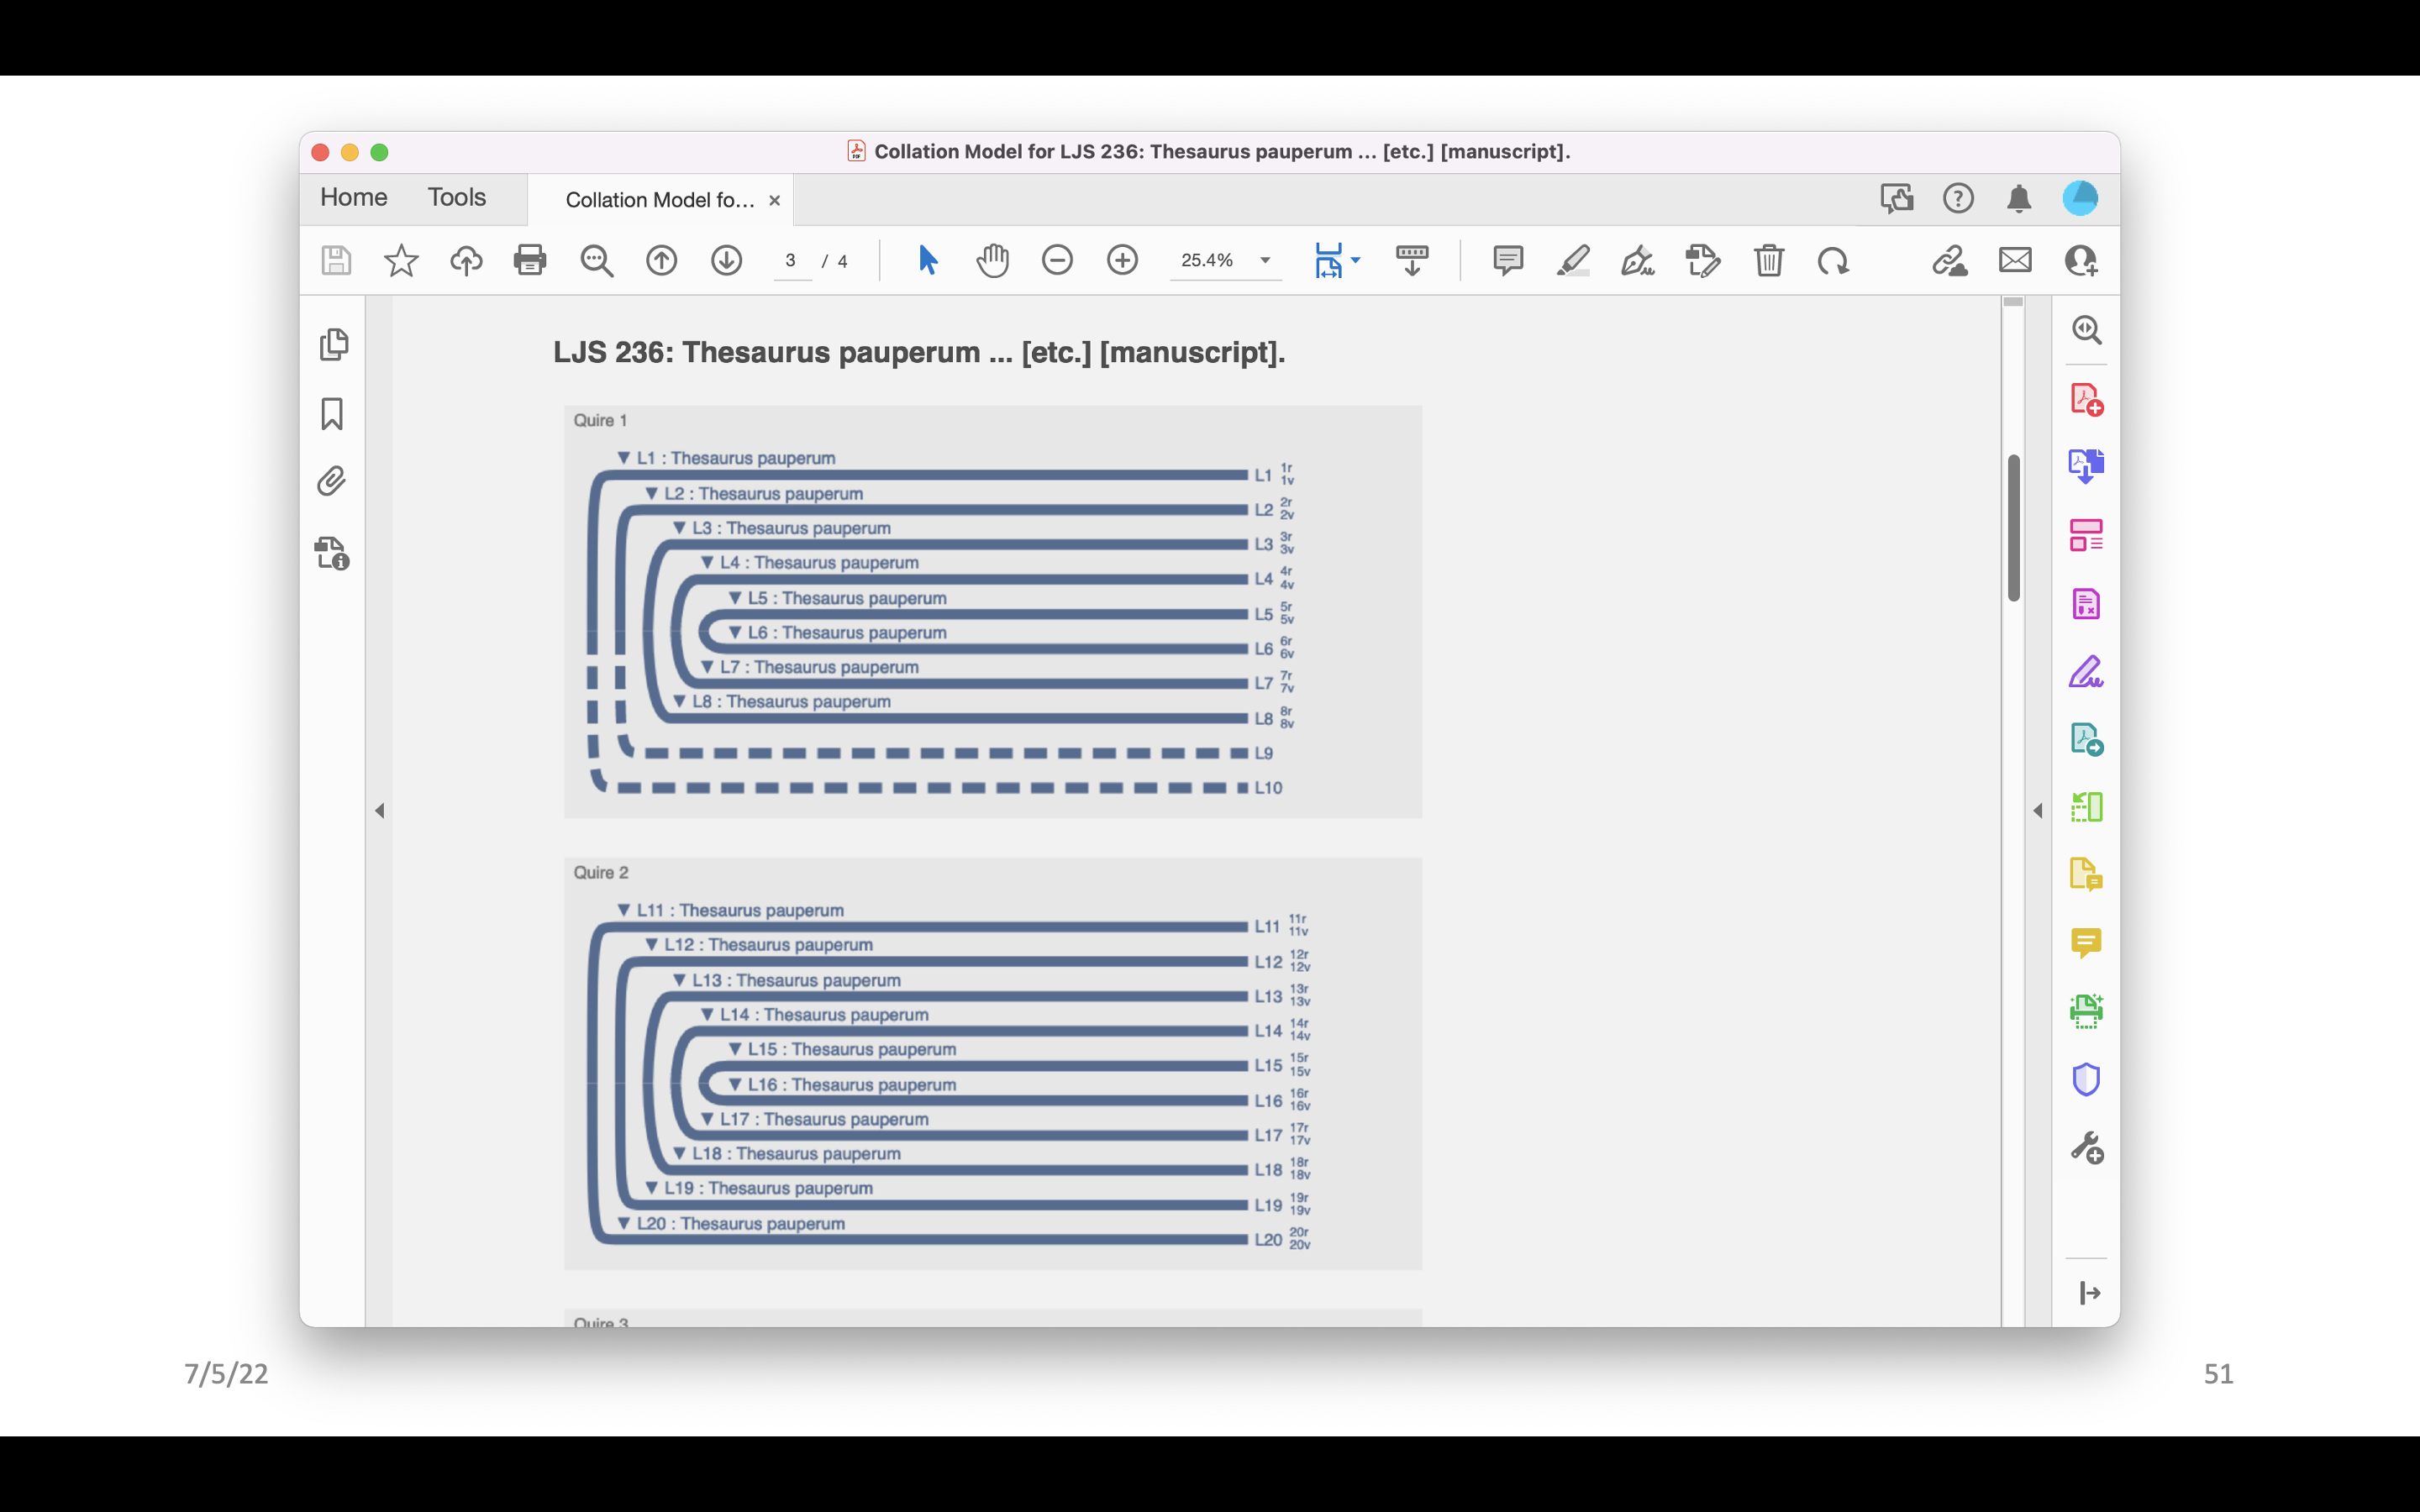
Here is what the PDF looks like coming out of the repository – it has the opening page added by the system that includes a bit of information from the record, and then it just has the diagram.
Realistically I think most people will simply want to look at the diagram model presented in the PDF or the PNG file, but some people might want to make changes or build their own work on what we provide. I hope that this will be a way to make the data available to people who are really going to use that. This approach – using systems already available to us, and my own curatorial labor for building the models – is our way of making visual information easily available that I think is much more helpful and much more useful than a formula, and making it available at scale for a collection instead of just focusing it on a handful of manuscripts.
I want to normalize the inclusion of structural information as a basic part of the catalog, not only as collation formulas but in ways that include structural details and that bring together other information about the book, such as contents and illustrations – an acknowledgement through data that a manuscript is not just a bunch of pages, it’s a complex object with pieces linked to each other. You’re not going to see this when you’re looking at digitized copies in most digital libraries, and sometimes not even when you’re looking at the book unless you’re really paying attention.
My hope is, with the availability of VCEditor and examples of incorporating structural data into catalogs and interfaces such as Bibliophilly, Heidelberg, and this project at Penn, that more institutions will consider how they might include visual data in addition to formulas in their existing systems.
Thank you.
Links:
VisColl: https://viscoll.org/
VCEditor: https://vceditor.library.upenn.edu/
Franklin: https://franklin.library.upenn.edu/
Collation Models on ScholarlyCommons: https://repository.upenn.edu/sims_models/ (more coming soon!)
University of Heidelberg: https://digi.ub.uni-heidelberg.de/diglit/bav_pal_lat_1/ BiblioPhilly Interface: https://bibliophilly.library.upenn.edu/
