
This is the full text of a talk I presented at the Parker on the Web 2.0 Symposium in Cambridge on March 16, 2018 (Please note addendum at the end which addresses an issue that came up in discussion later in the day.)
I want to begin my presentation by talking about interface.
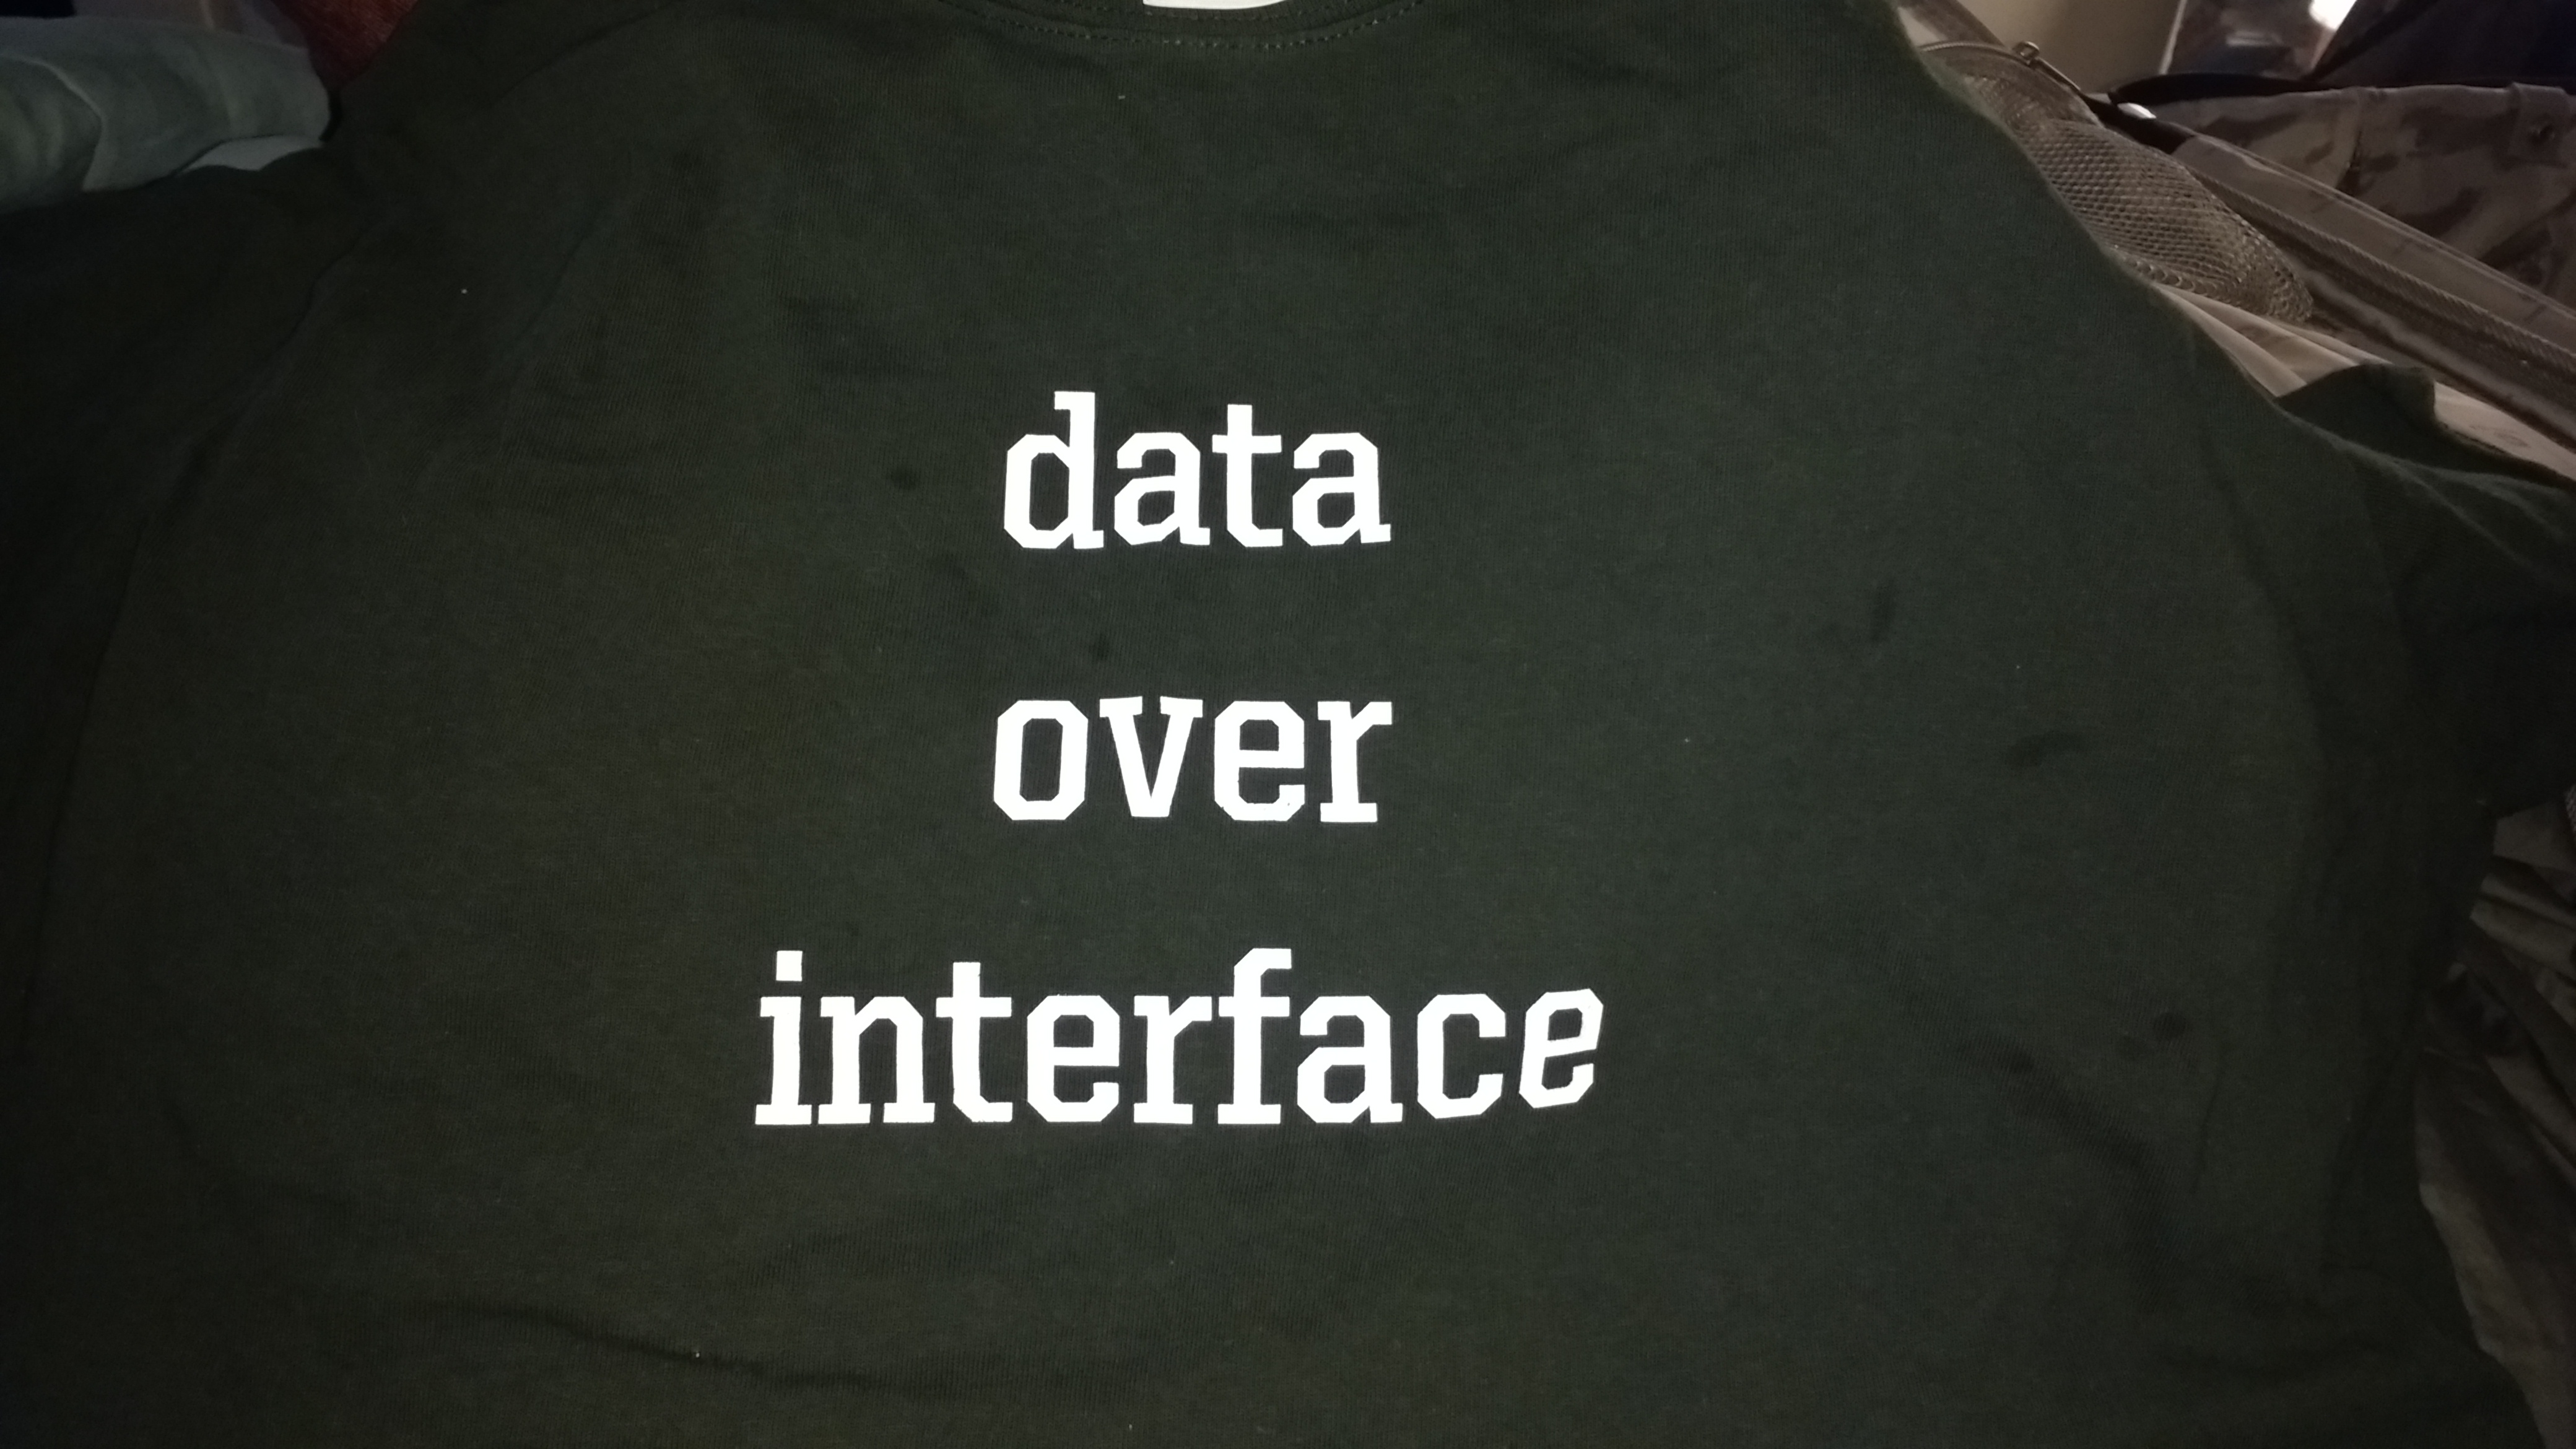
A couple of years ago I presented a keynote at a digital humanities conference on digital editing in which I made the argument that data for a project should take precedence over the interfaces used to present that data. (I stole this idea from my colleague Doug Emery, and I liked it so much, I had it put on a teeshirt). In my talk today I want to investigate how data and interface work together, how existing interfaces can influence both the data we gather and the development of new interfaces, and some ways that we can think around existing interfaces to develop new ones (and what this in turn means for our data).
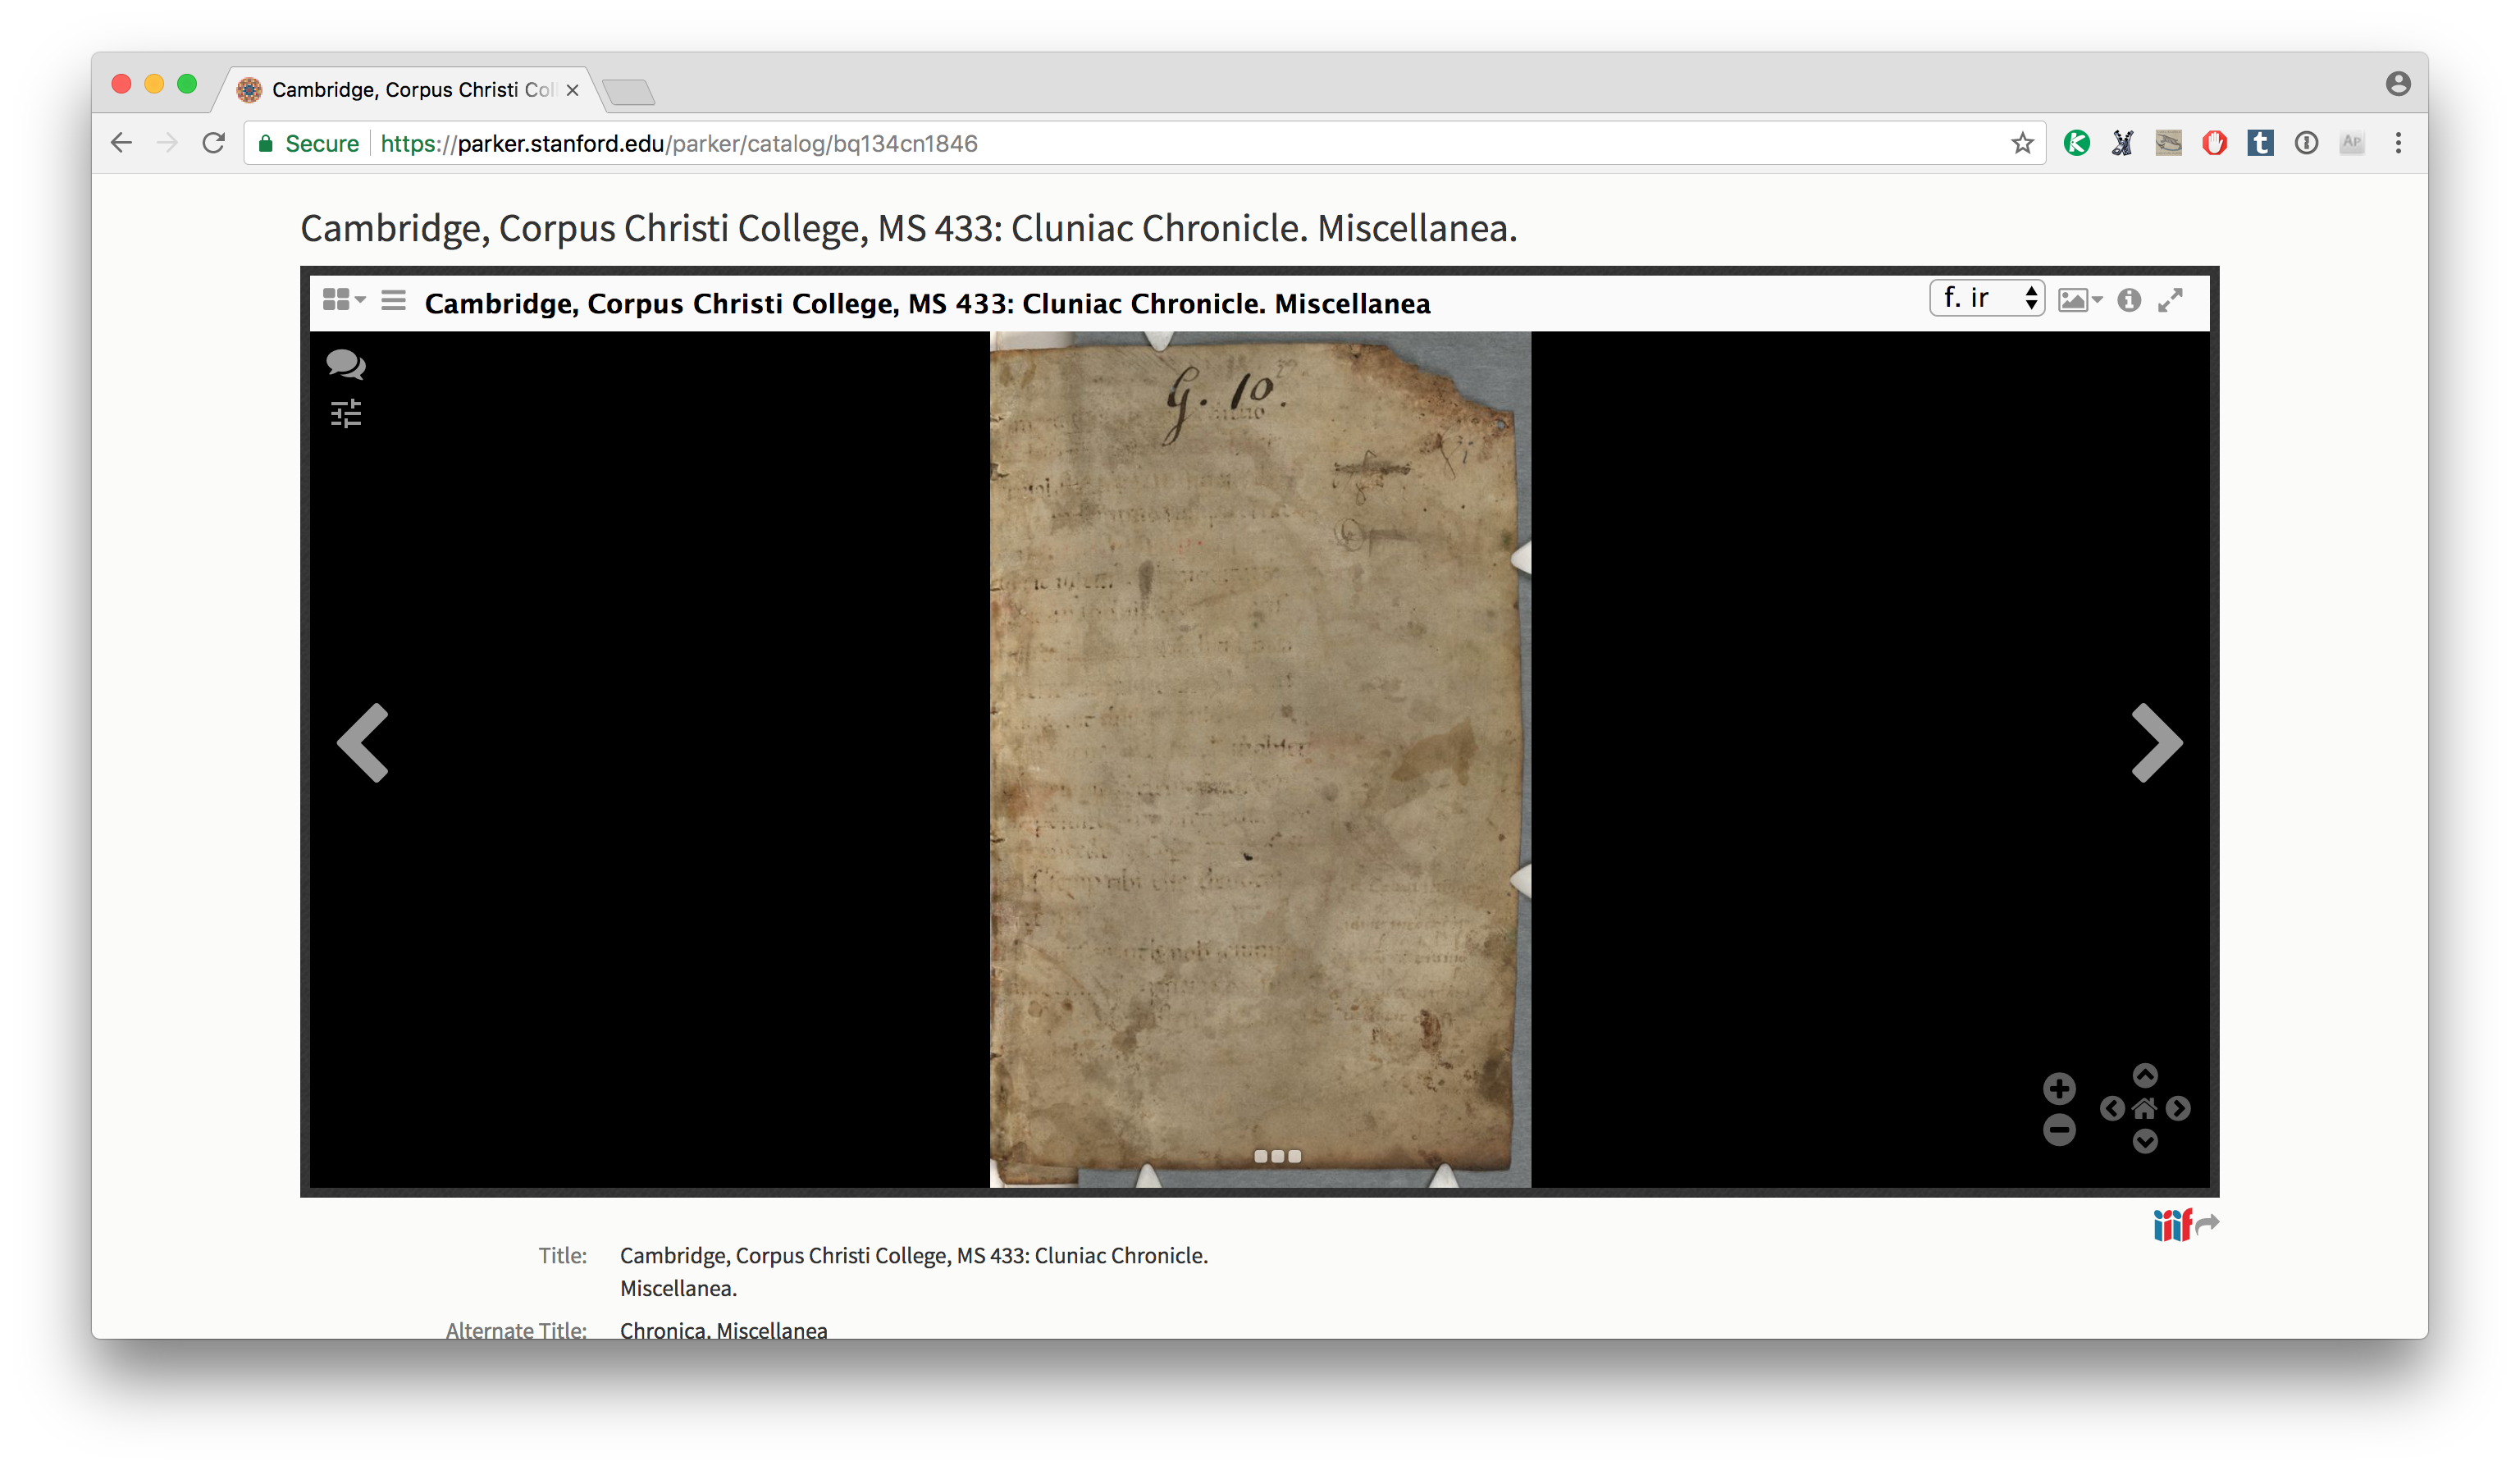
This is MS 433, a Miscellany copied in a number of hands from the 13th into the late 15th century. If you want to see this manuscript, you have a few different options, which you can access through the menu in the top right.
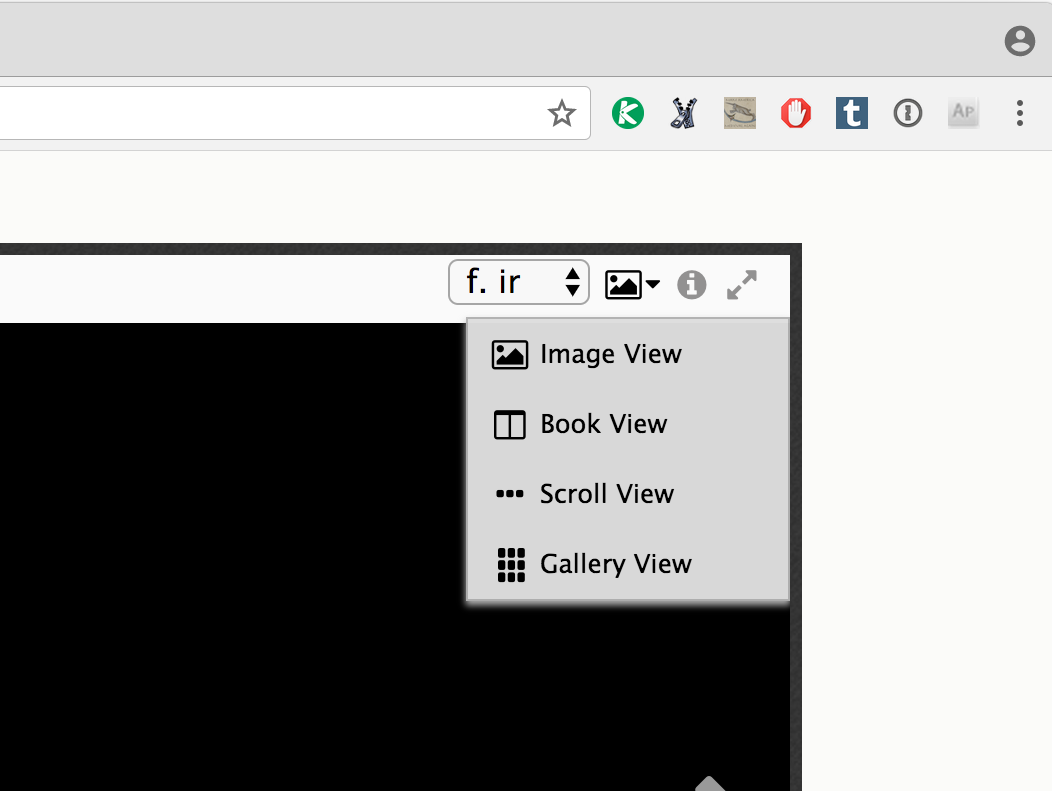
The options are: Image View, Book View, Scroll View, and Gallery View. You probably know exactly what you’ll get when you make a selection here: Image View will present you with a single image, Book View will show the book openings, also known as facing pages (as Dr Anne McLaughlin said in her introduction at the Symposium, Book View presents the images “as a book, so when I turn the pages, it looks like a book”), Scroll View will show all the page images in a continuous row that you can scroll through back and forth, and Gallery View will show all page images as thumbnails in a single page.
Each of these views serves a different purpose: Image View, Book View, and Scrolling view present the images in a size large enough to read, with slightly different methods for moving through the book, while gallery view is more like a finding tool that also gives you the ability to get the “sense” of the aesthetic contents of a book: the relative size of script and written area, distribution of illuminations or miniatures, that kind of thing (as Anne said in her introduction, in this view you can “look at the whole thing – look for initials, for something pretty to look at”). You wouldn’t read a text in the Gallery view, you would select an image from that view and then interact with that larger image (clicking on a thumbnail in the Gallery view on Parker takes you to the Image View).
I want to consider for a moment why we present digital manuscript images in these ways. Let’s start by looking at some examples of non-digital manuscript facsimiles.

For example, here’s an opening from the 1933 Early English Manuscripts in Facsimile facsimile of the Exeter Book. The pages face each other in the manuscript (this is 65b and 66a), but they’ve been decontextualized, presented in frames and with labels underneath.
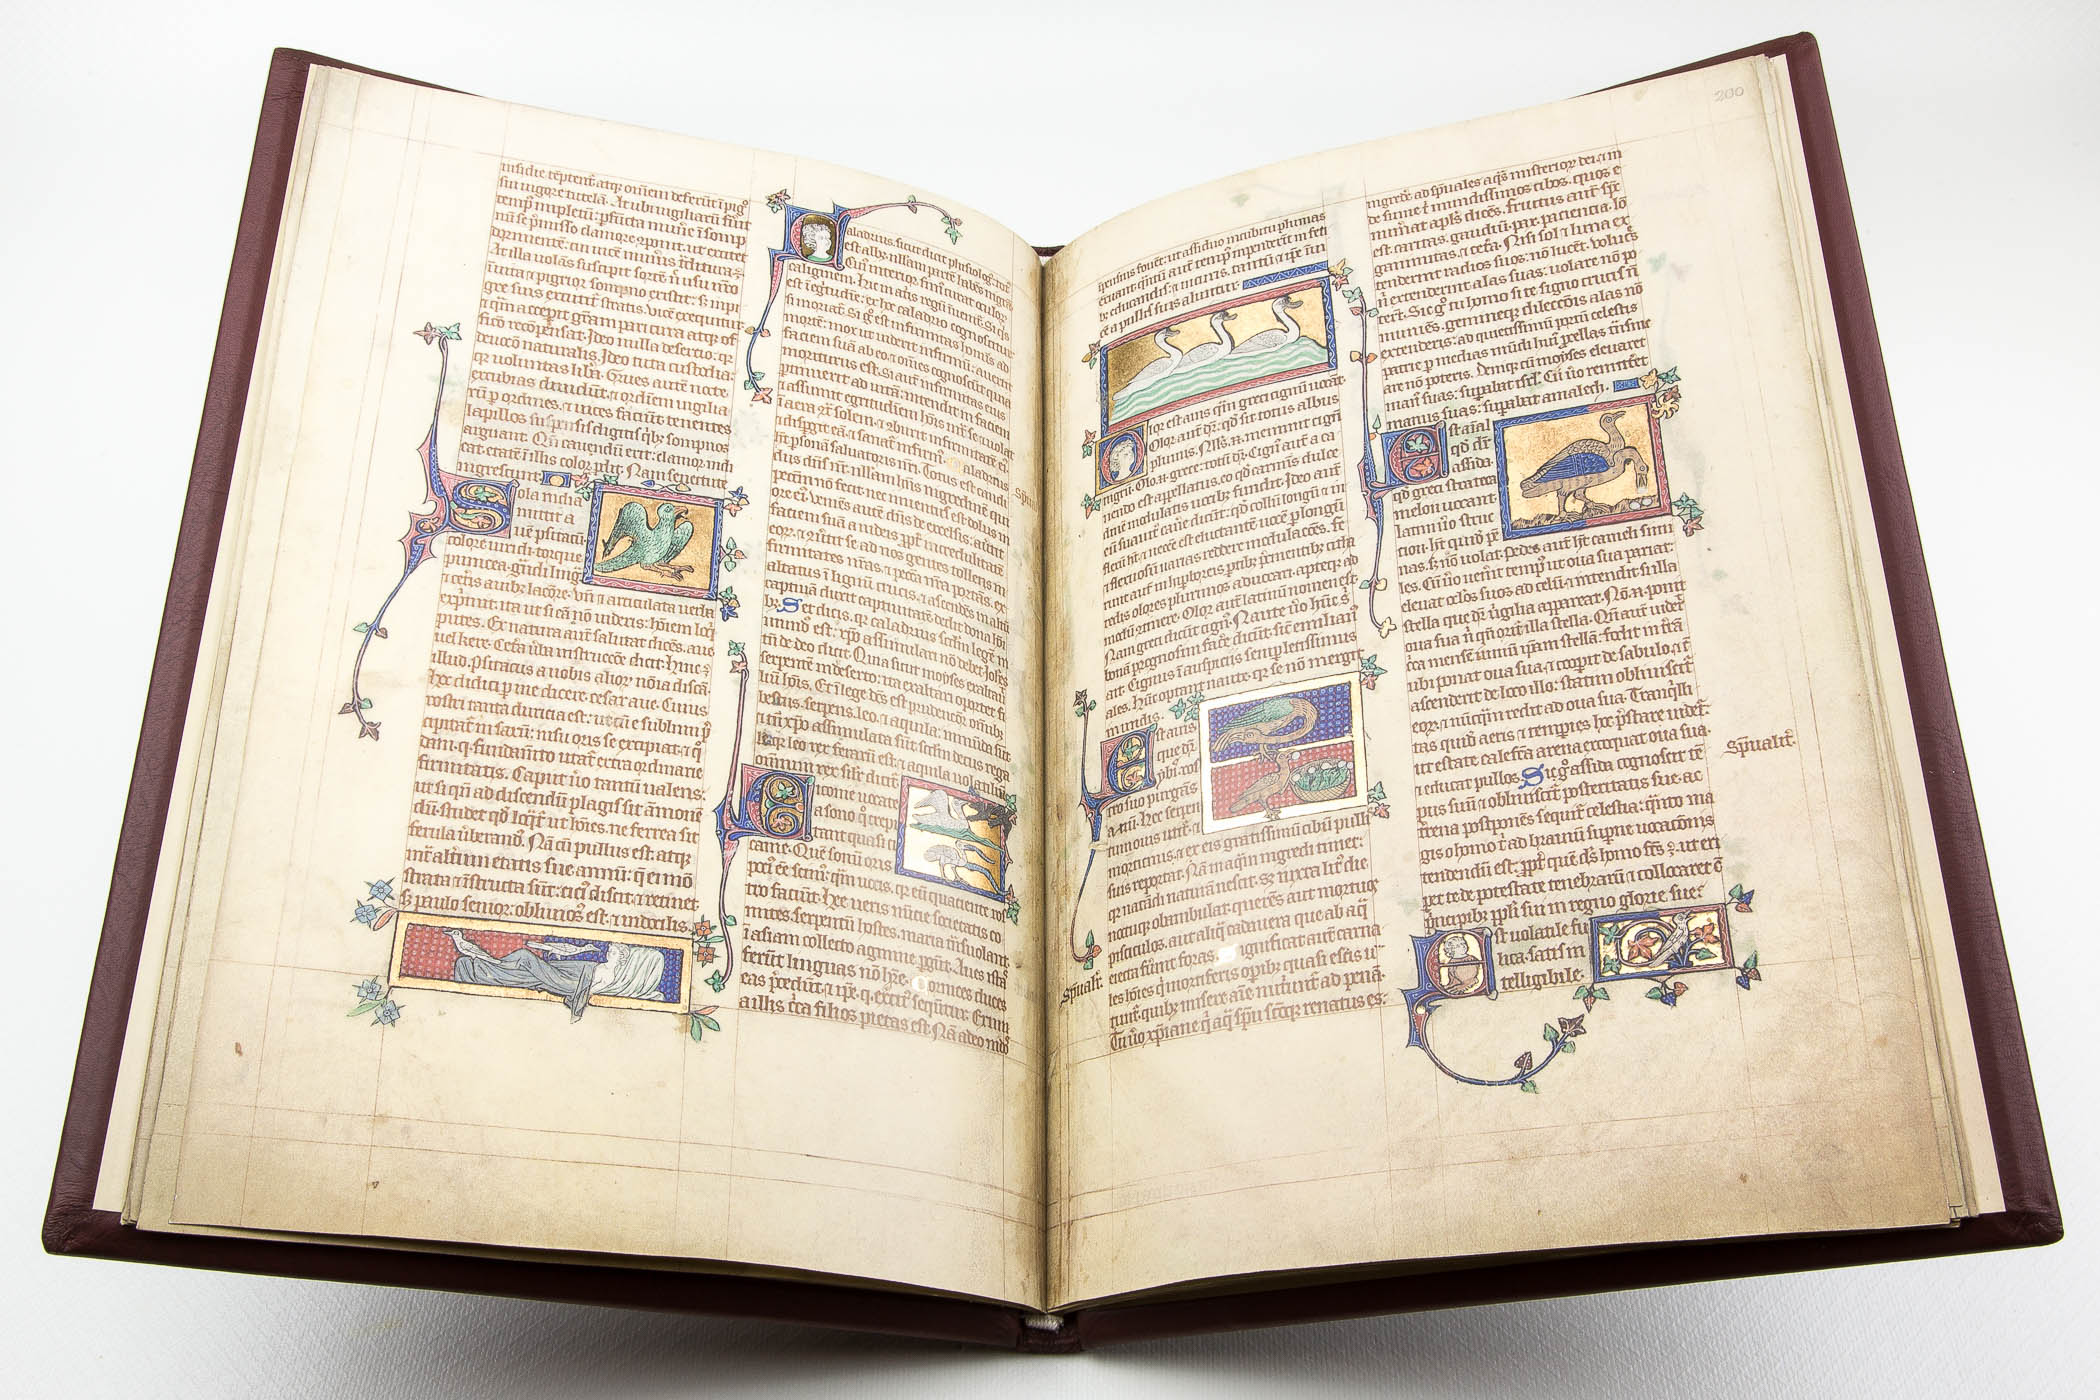
Compare this with the Salerno Editrice edition of the Peterborough Bestiary, published in 2004, which looks very much like what I imagine the manuscript looks like (I haven’t seen it so I can’t say for sure, but it definitely looks like a manuscript, unlike the Exeter Book facsimile, which looks like pictures of pages reproduced in a modern book).
https://blogs.acu.edu/csart/2017/02/08/from-microfilm-to-mass-media-biblical-manuscripts-in-the-digital-age/
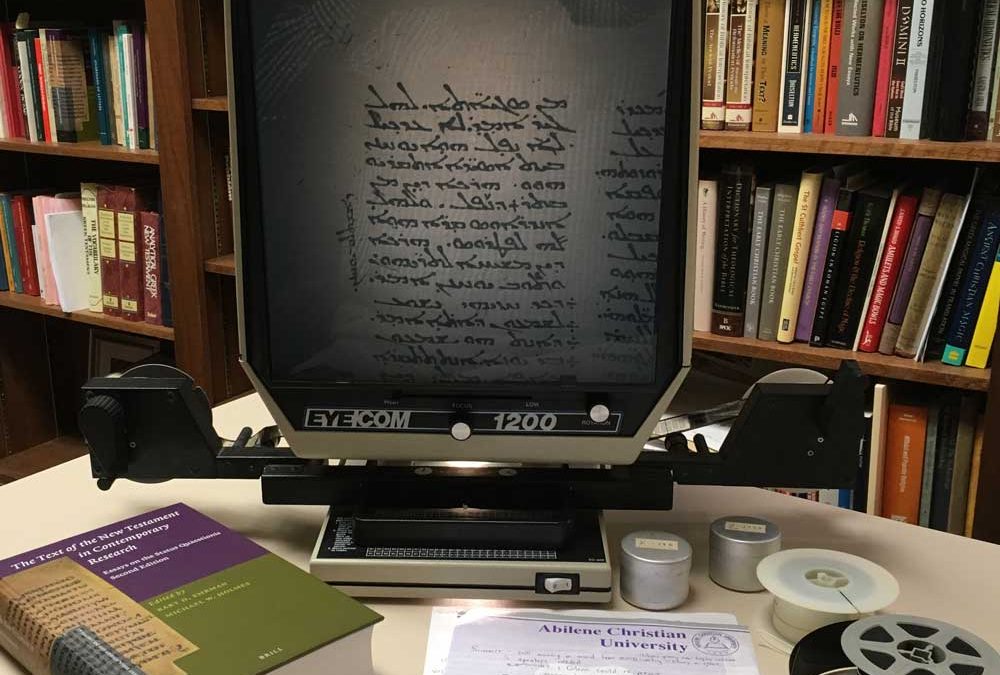
And here’s something that is probably familiar to many of us: Microfilm, which presents images on a long ribbon of film, which you scroll through a special machine to find whichever page you want.
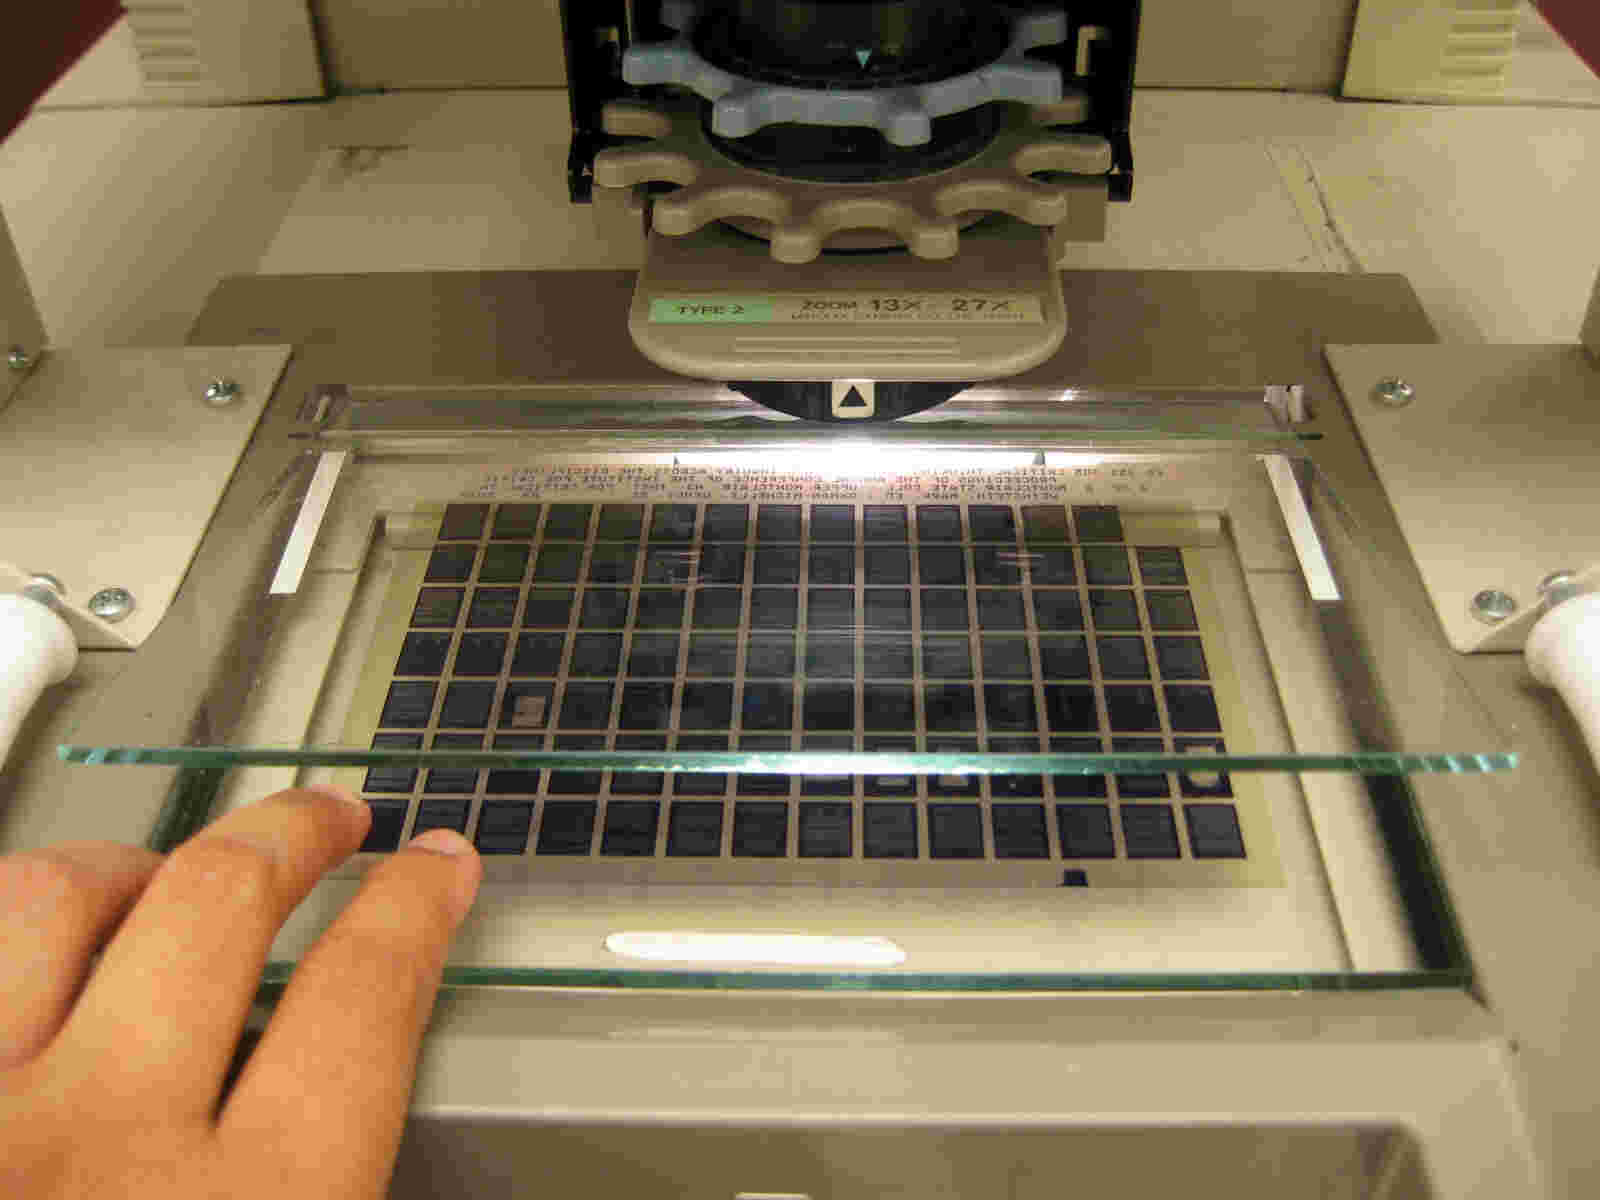
Finally, there’s Microfiche, which consists of rectangles of film onto which small images of pages are presented in a grid.
I expect you can see where I’m going with this, because I’m not exactly being subtle. The options for viewing manuscripts in Parker on the Web are basically the same as they have always been. The difference is that instead of having to go to a library to check out a book or access a reader (or order a book through interlibrary loan, if your library doesn’t own it), that you can access them in your office, or at your house, at all times of day (as long as your Internet is working, and the system isn’t down).
It’s not just the Mirador Viewer (the interface that provides image access in Parker on the Web) that has these options, every online environment for viewing medieval manuscripts will have some similar setup with at least a page-turning interface and frequently a selection of the other three. E-codices is the only interface I know of that has another option: to view the front and back of a leaf at the same time, which is pretty cool (The Scroll View also shows the front and back of leaves side by side, but in e-codices you can purposefully select this view. If you know of any other interface with unique views I would be very happy to know about them).
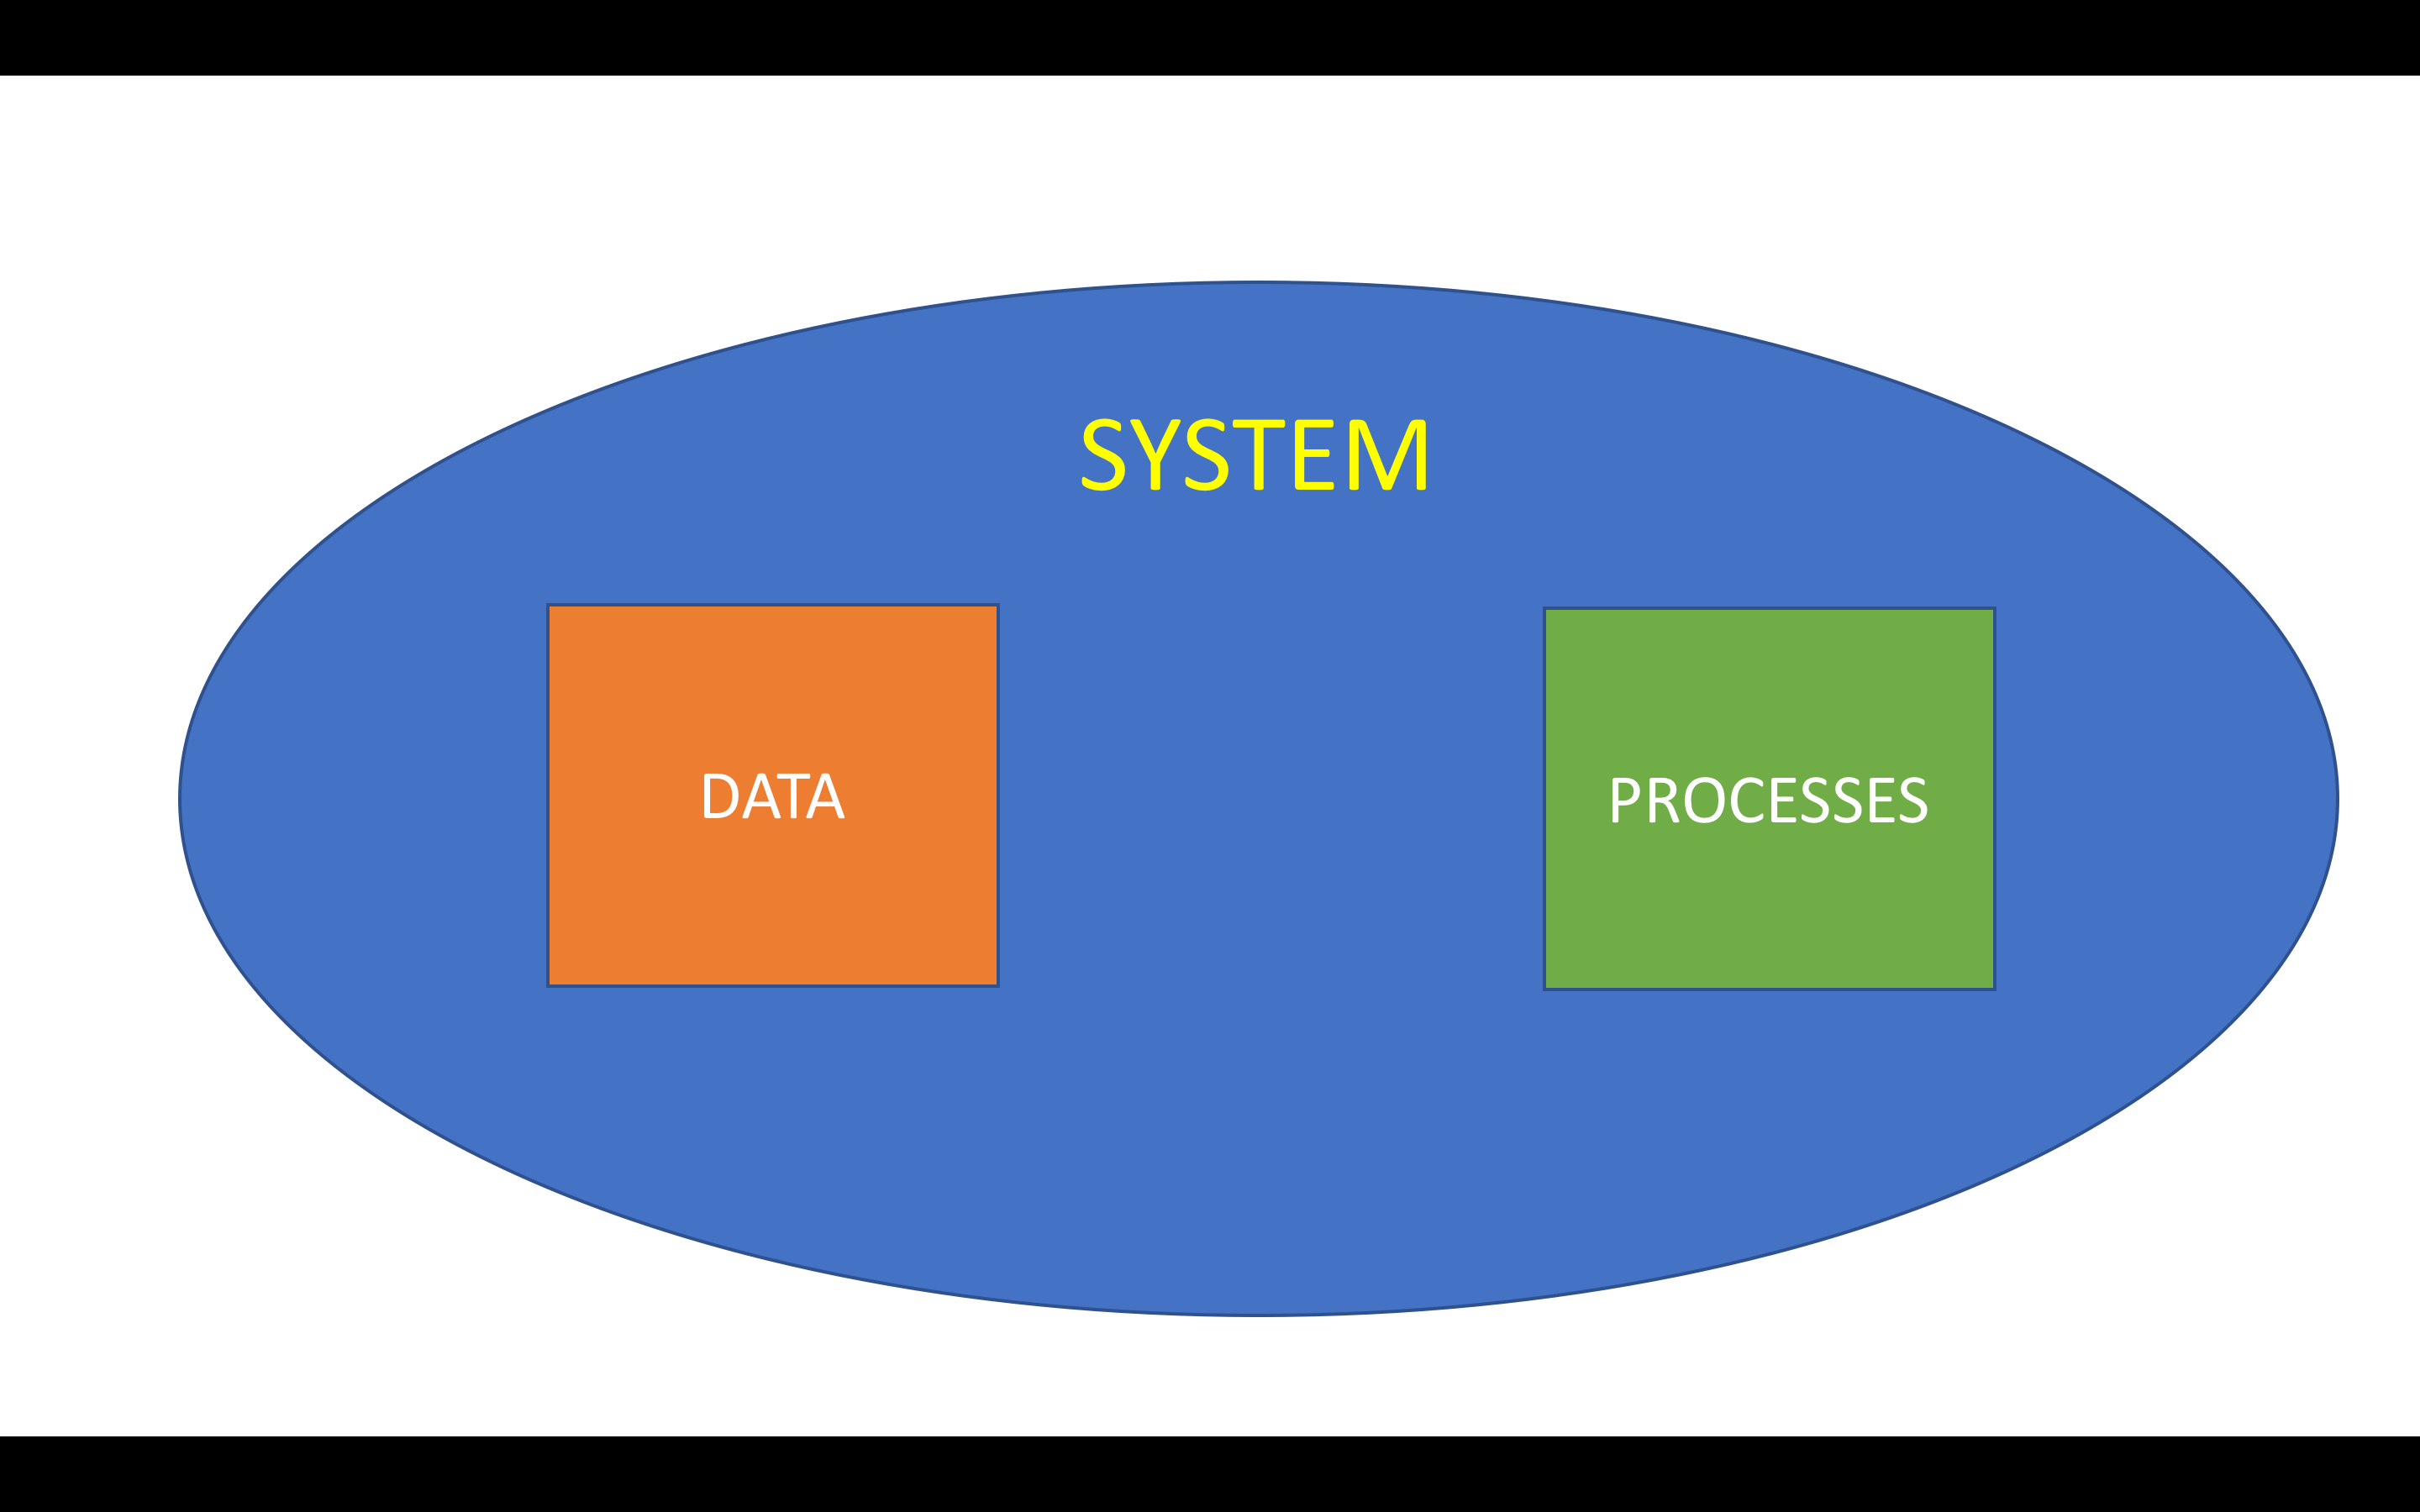
Why is it the case that all manuscript libraries have basically the same interfaces? One reason is probably because, as we can see from the non-digital examples above, that’s the way we’ve always done it. We are used to seeing manuscripts as single pages, and facing pages, and scrolling pages, and galleries of pages, so that’s how we present them digitally. But it becomes a self-fulfilling prophecy. This is how we view manuscripts, so we create systems that allow us to look at manuscripts in this way. If we want to look at manuscripts in a different way, we need to build new systems. Keep in mind that in a computer system you have two things that need to work together: You need data (information presented in a format that the computer can work with), and you need processes (software or scripts that take that data and do something with it). (This is a really simplified view, of course, but I think it works pretty well)
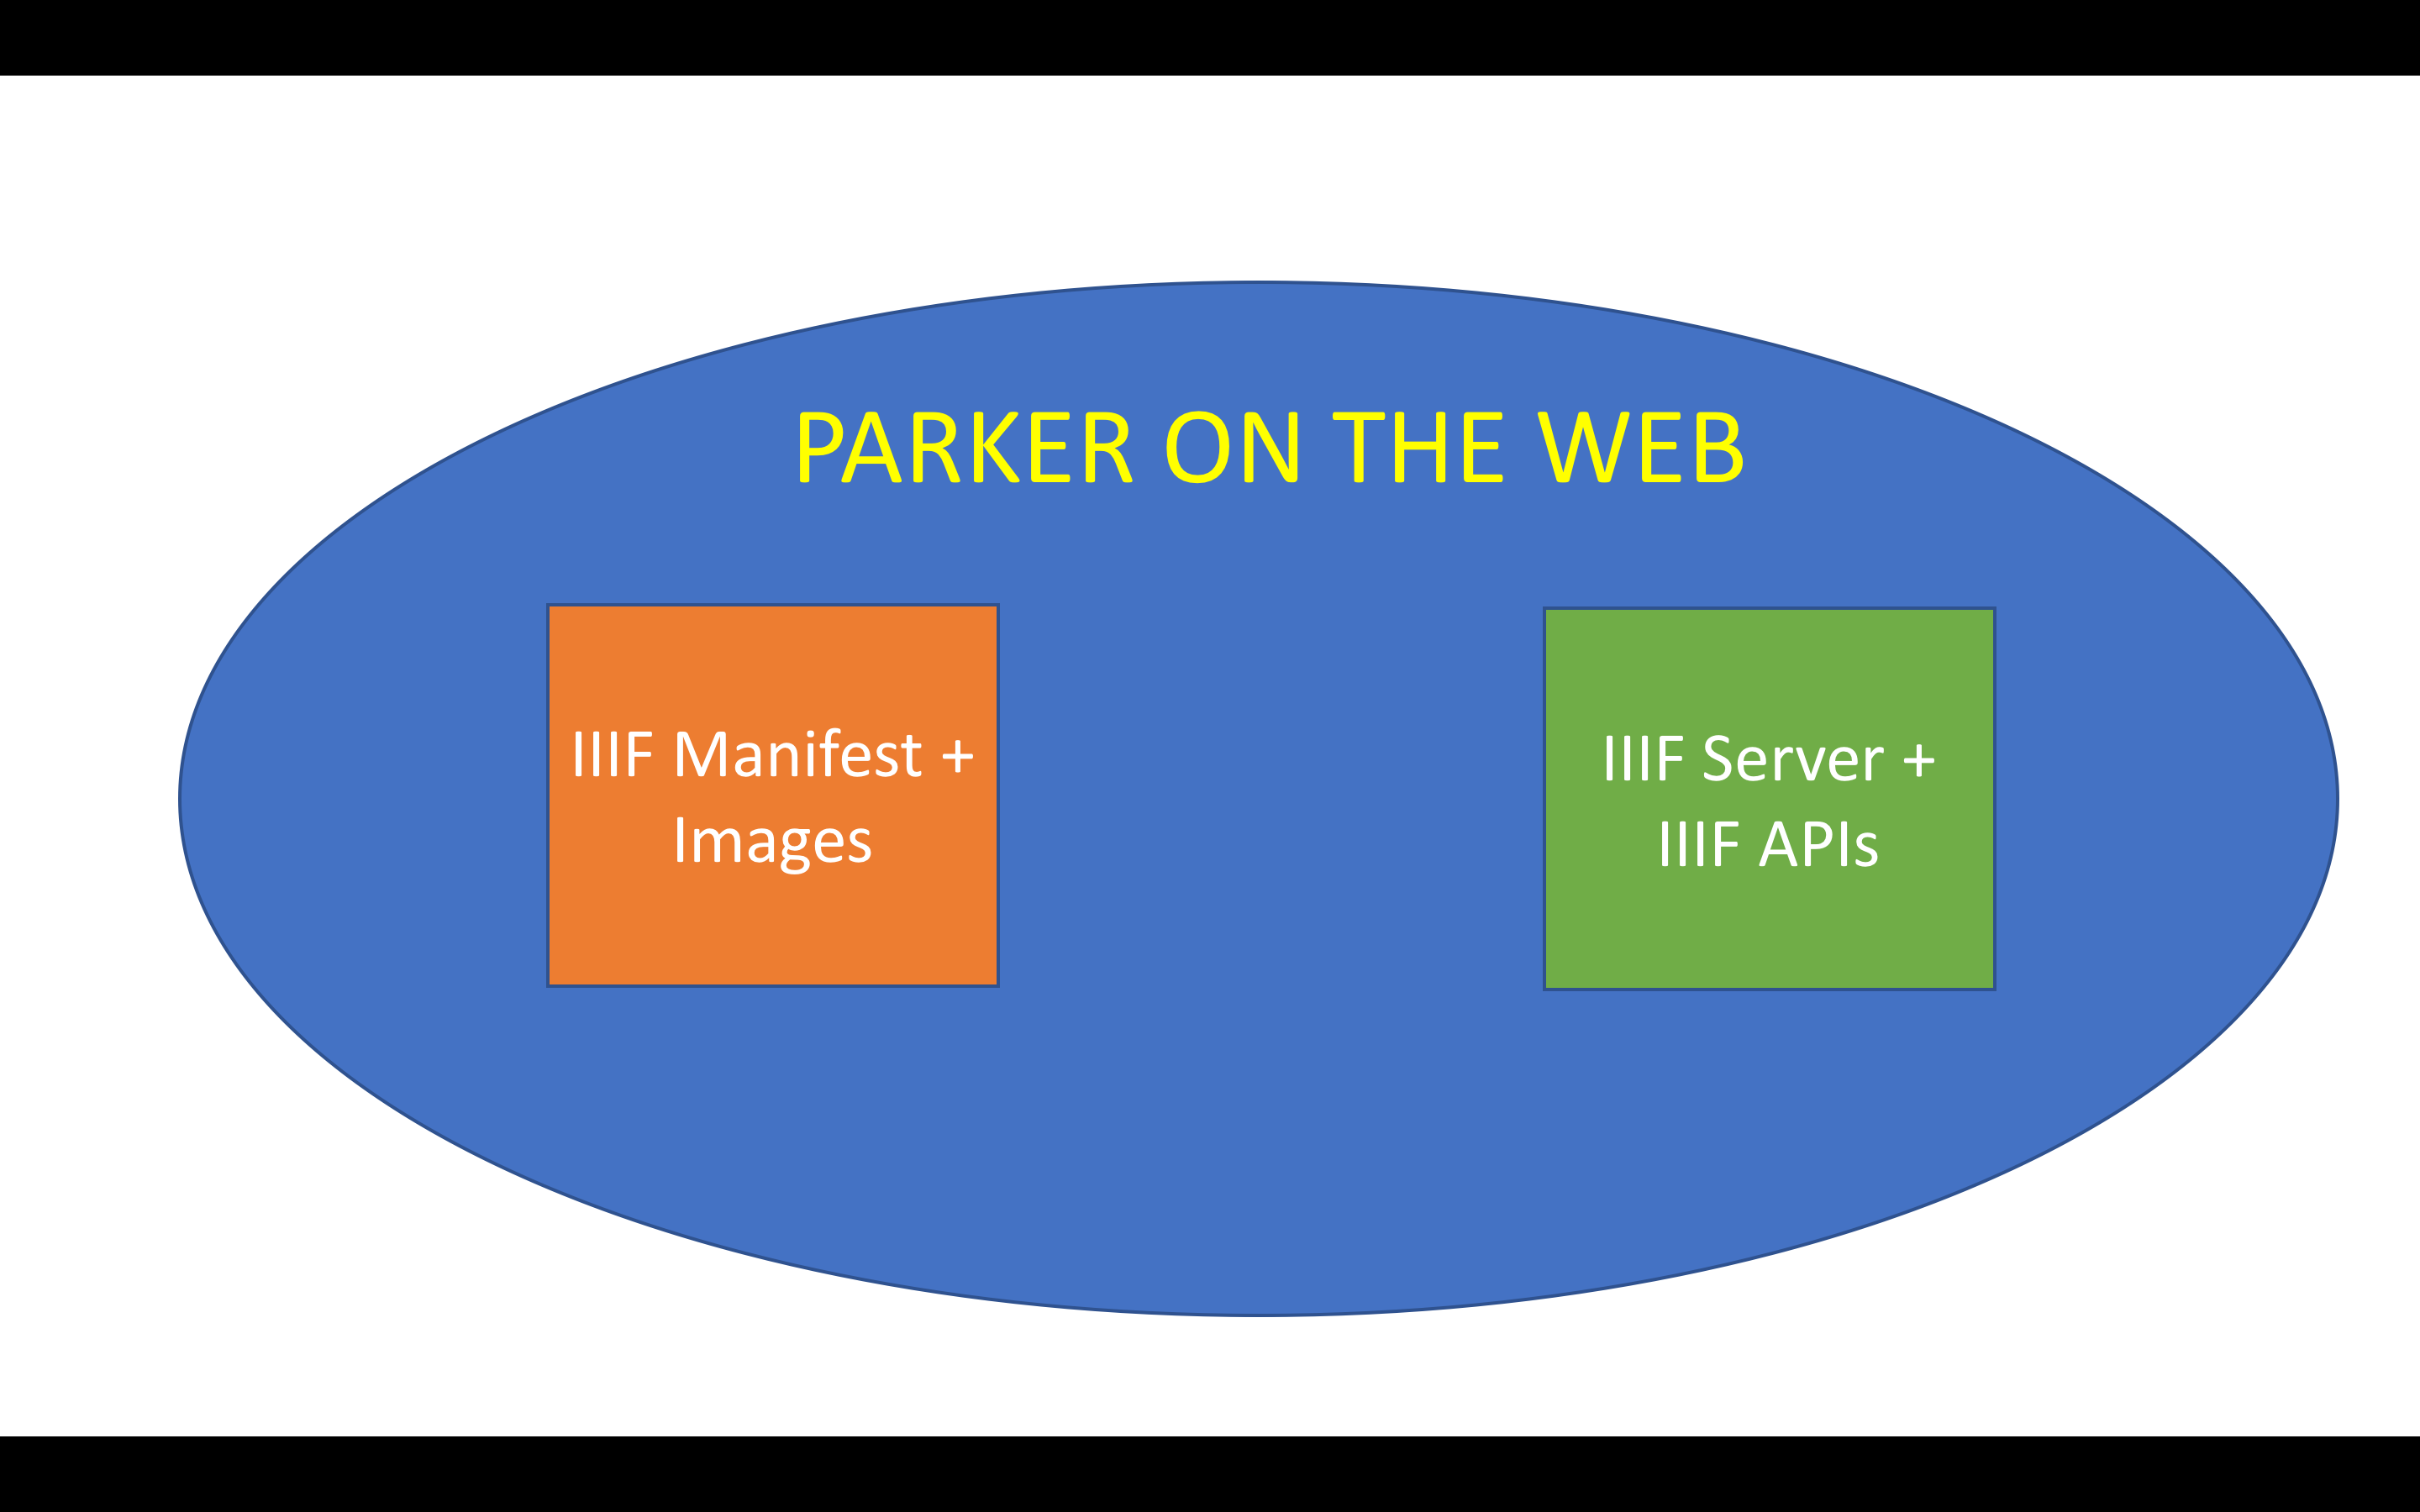
Parker on the Web, for example, is a IIIF system, so in order to function it needs IIIF Manifests, which provide metadata in a specific format in addition to links to images served in a specific way, and it needs the IIIF server to serve the images, and the IIIF APIs (or more properly, software built to work with the APIs). If any piece of this system doesn’t meet specification – if the manifest is formatted incorrectly, or the image links don’t point to a IIIIF image server, or the software doesn’t reference the APIs correctly – the system won’t work. Without both data and processes – data and processes designed to work together – you won’t have a working system.
I’m interested in creating new ways to present digitized manuscripts, and the frame I’m using is that of the manuscripts collation. Rather than displaying a digitized manuscript only as a series of images of pages arranged from beginning to end, I want to create displays that take into account pages as leaves connected to each other through the pattern of the quiring: the collation.
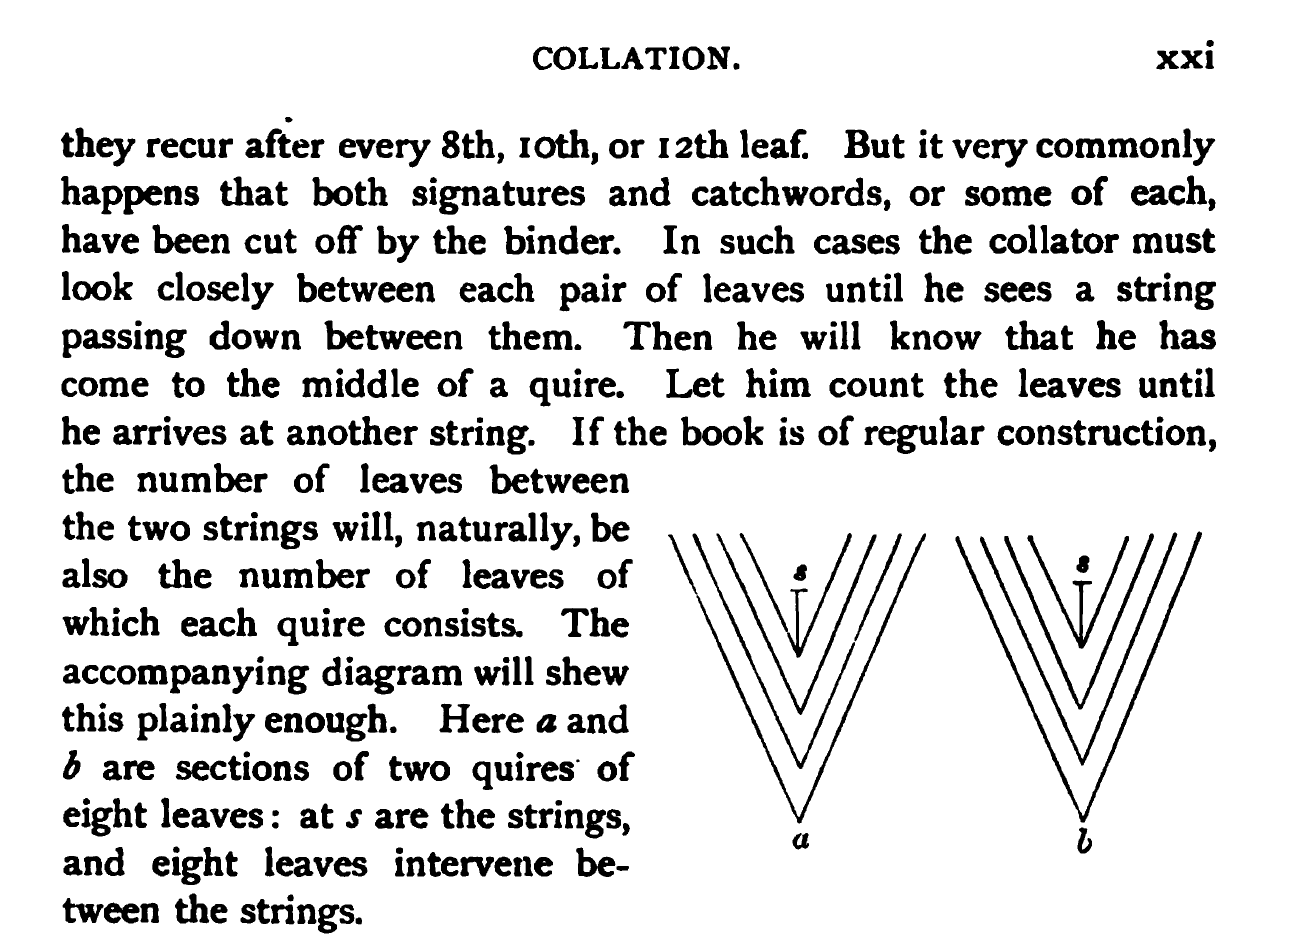
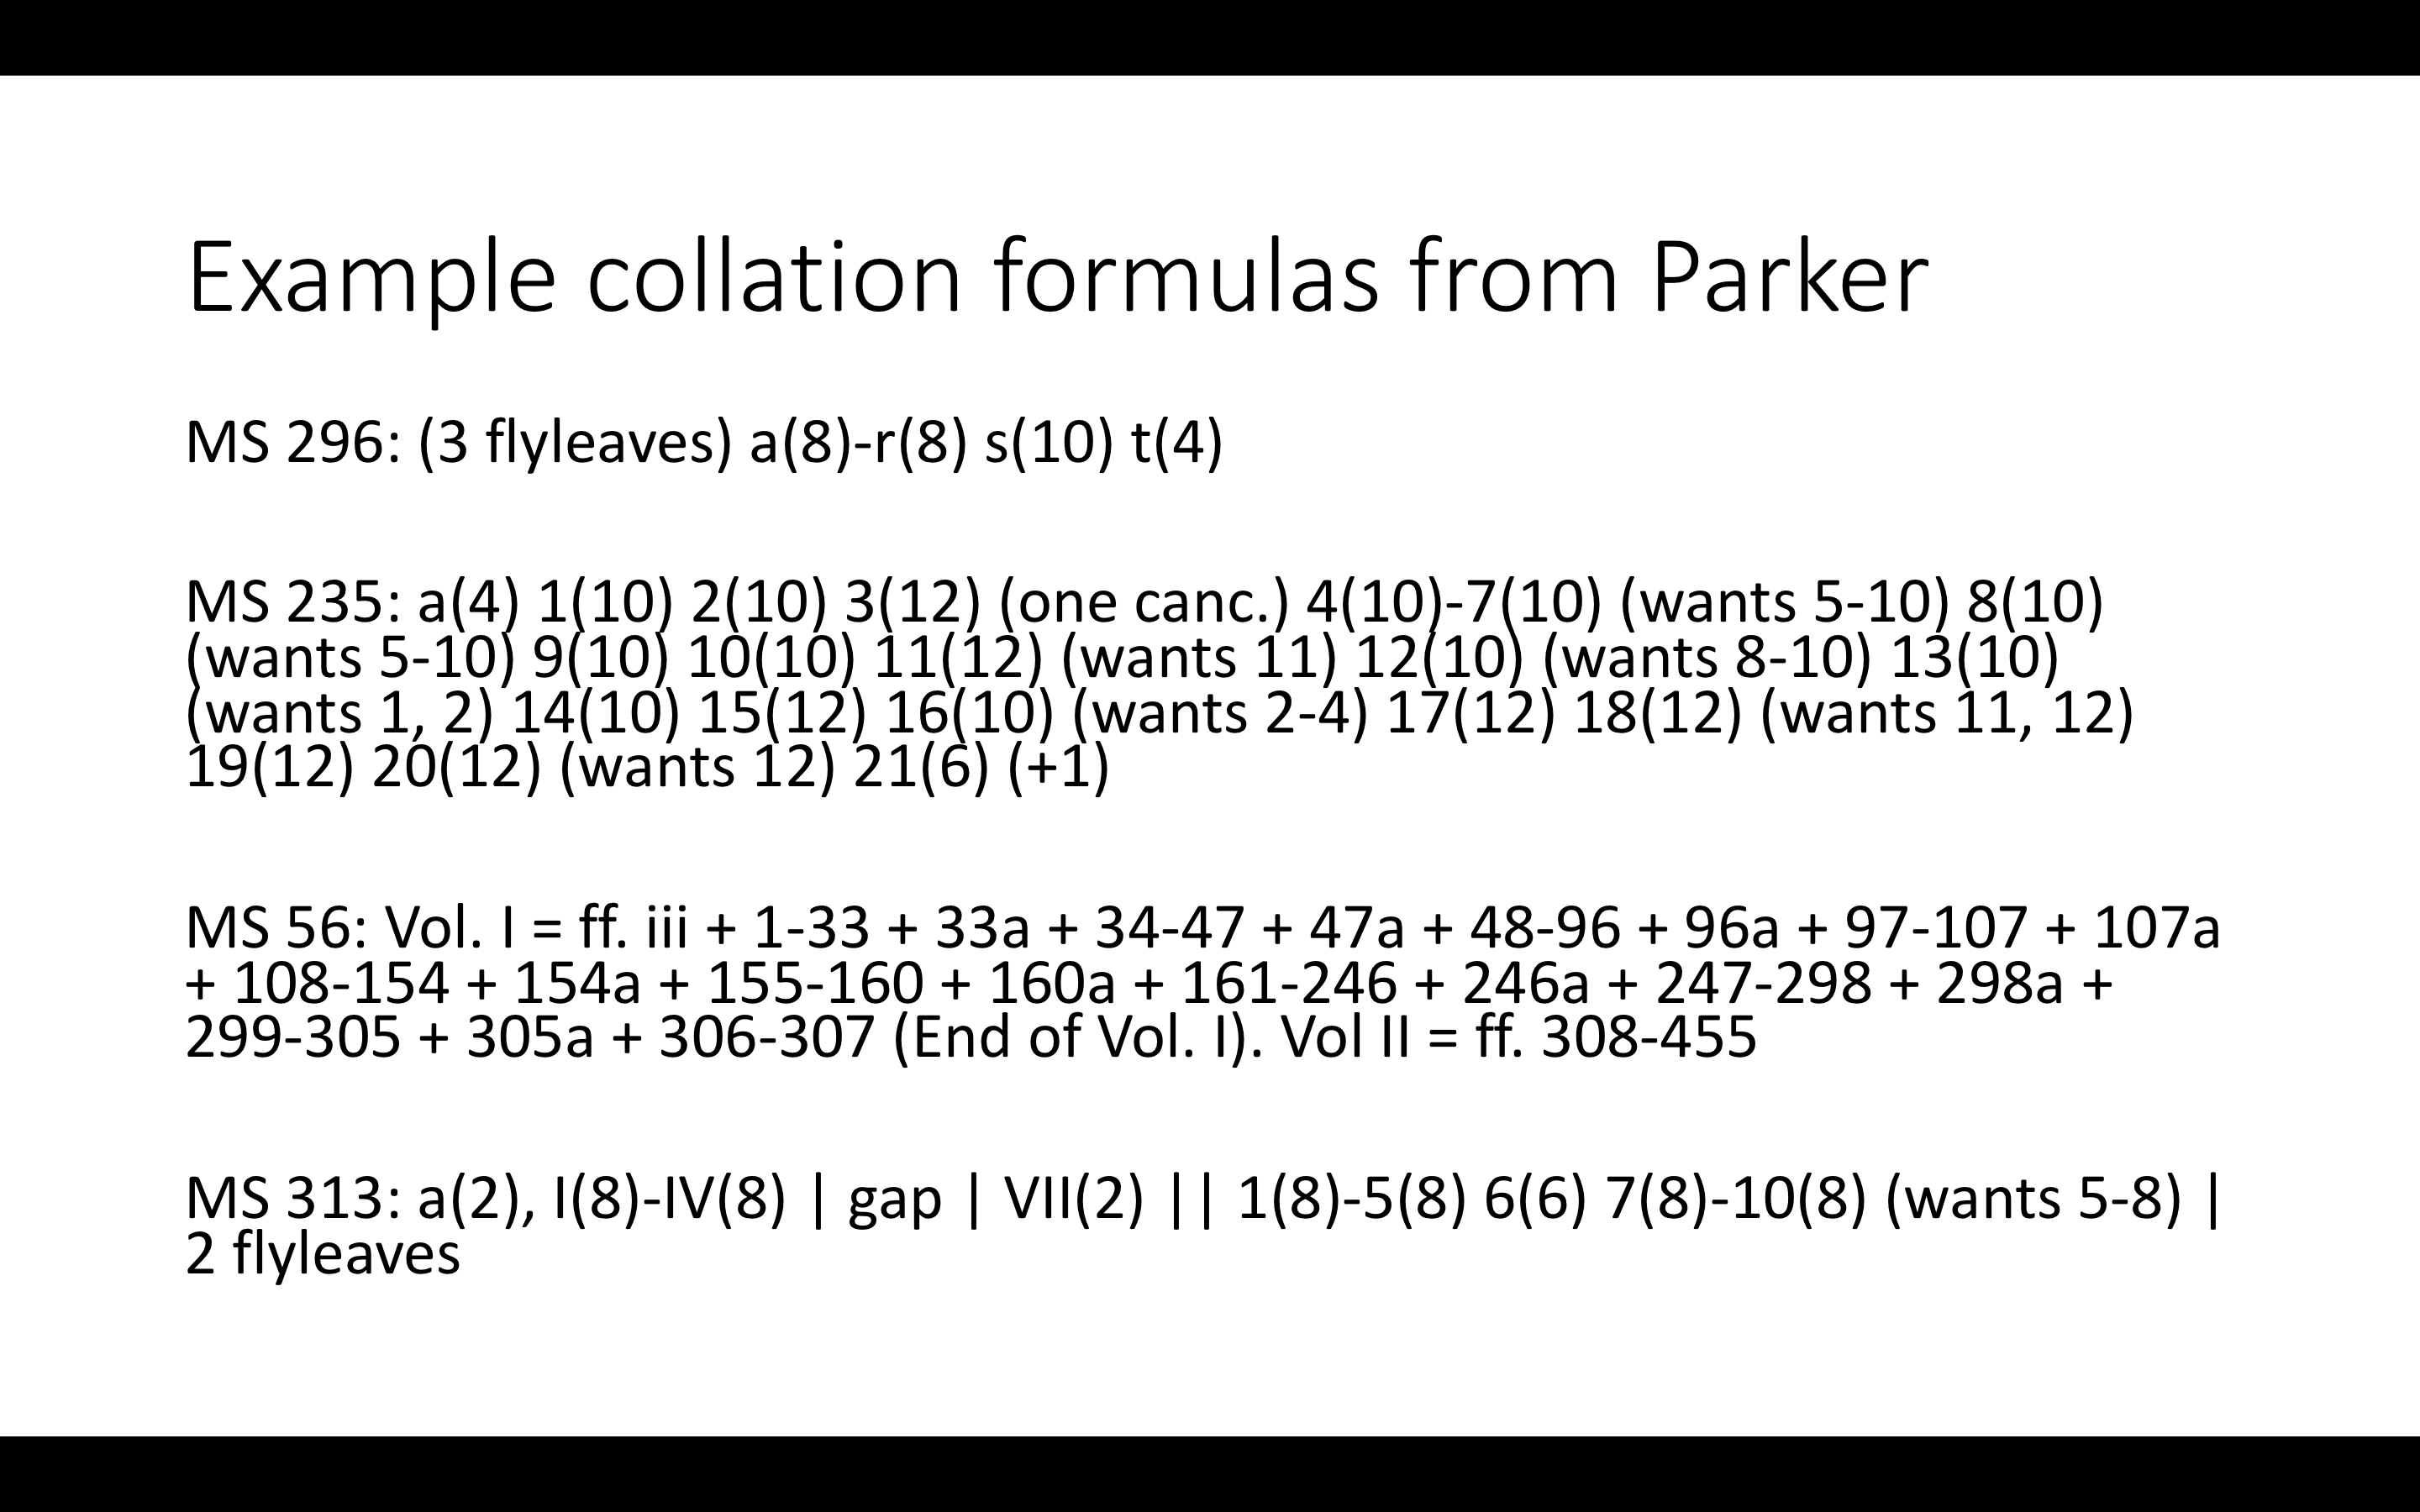
Collation isn’t a new way to think about manuscripts. In his 1895 Catalog of the Fitzwilliam Museum, M. R. James wrote a description of how to collate a manuscript, and also included collation formulas in most of the manuscript descriptions (a few random examples are in the figure below).
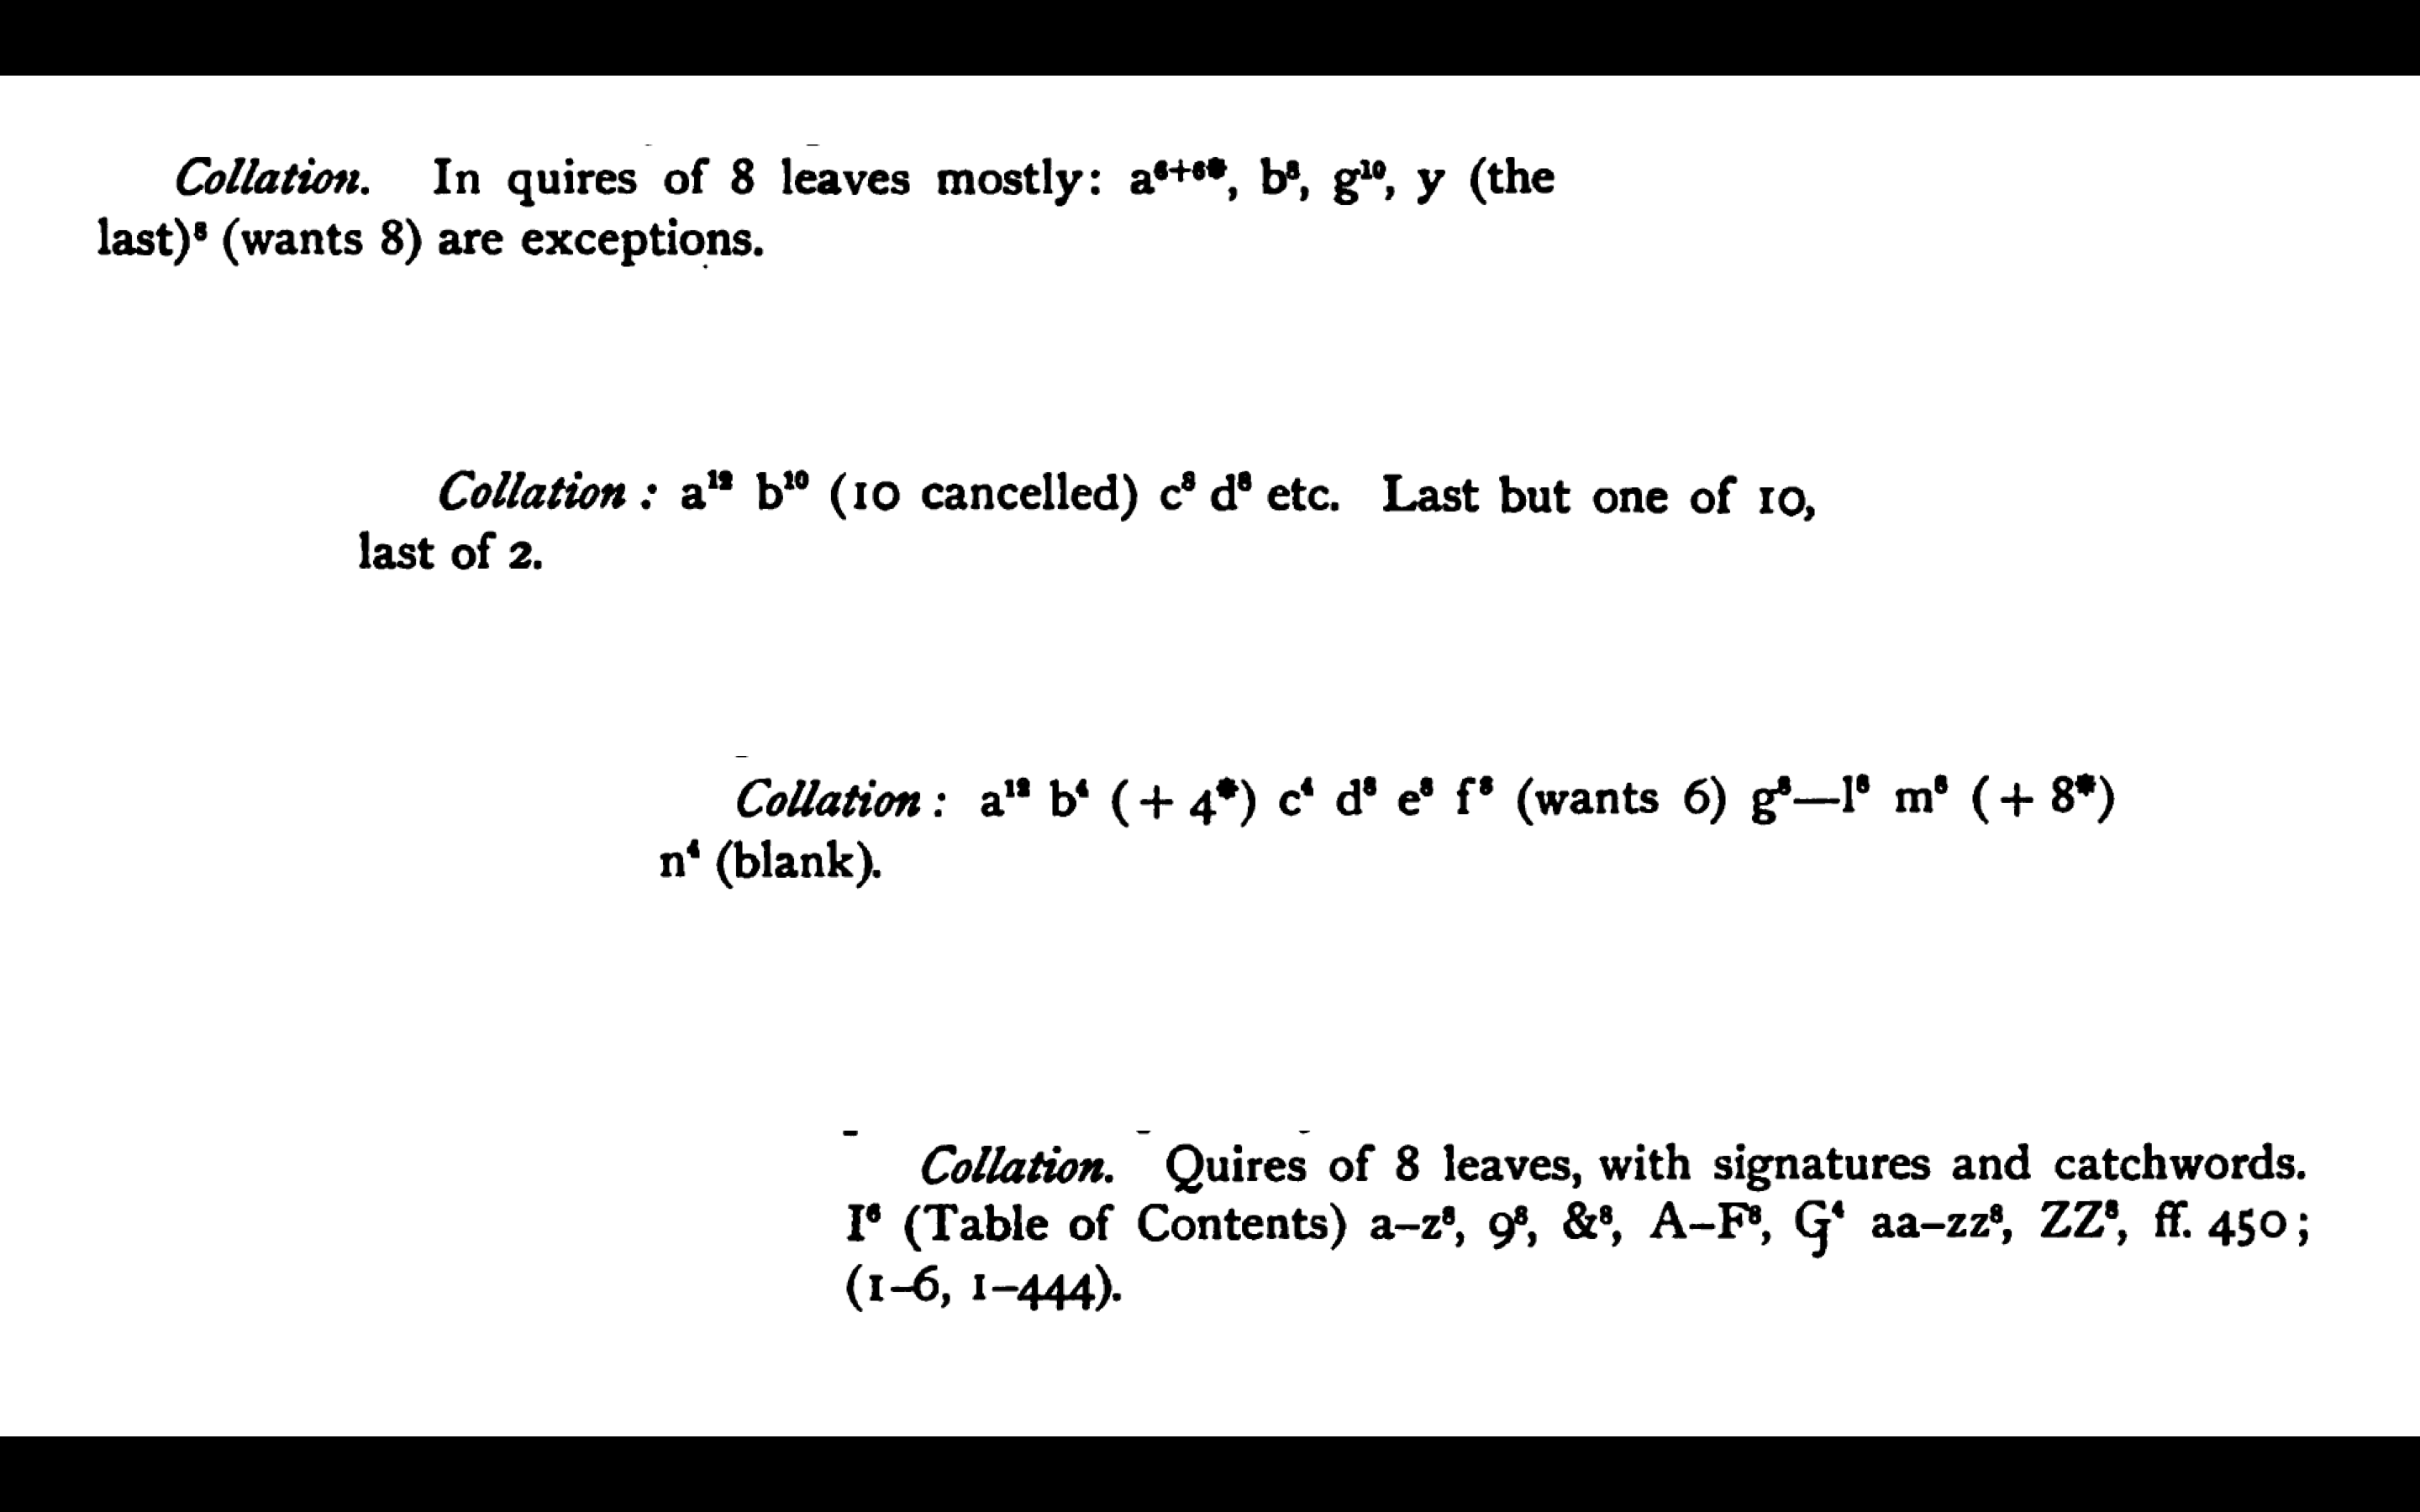
The Parker on the Web also includes collation formulas.
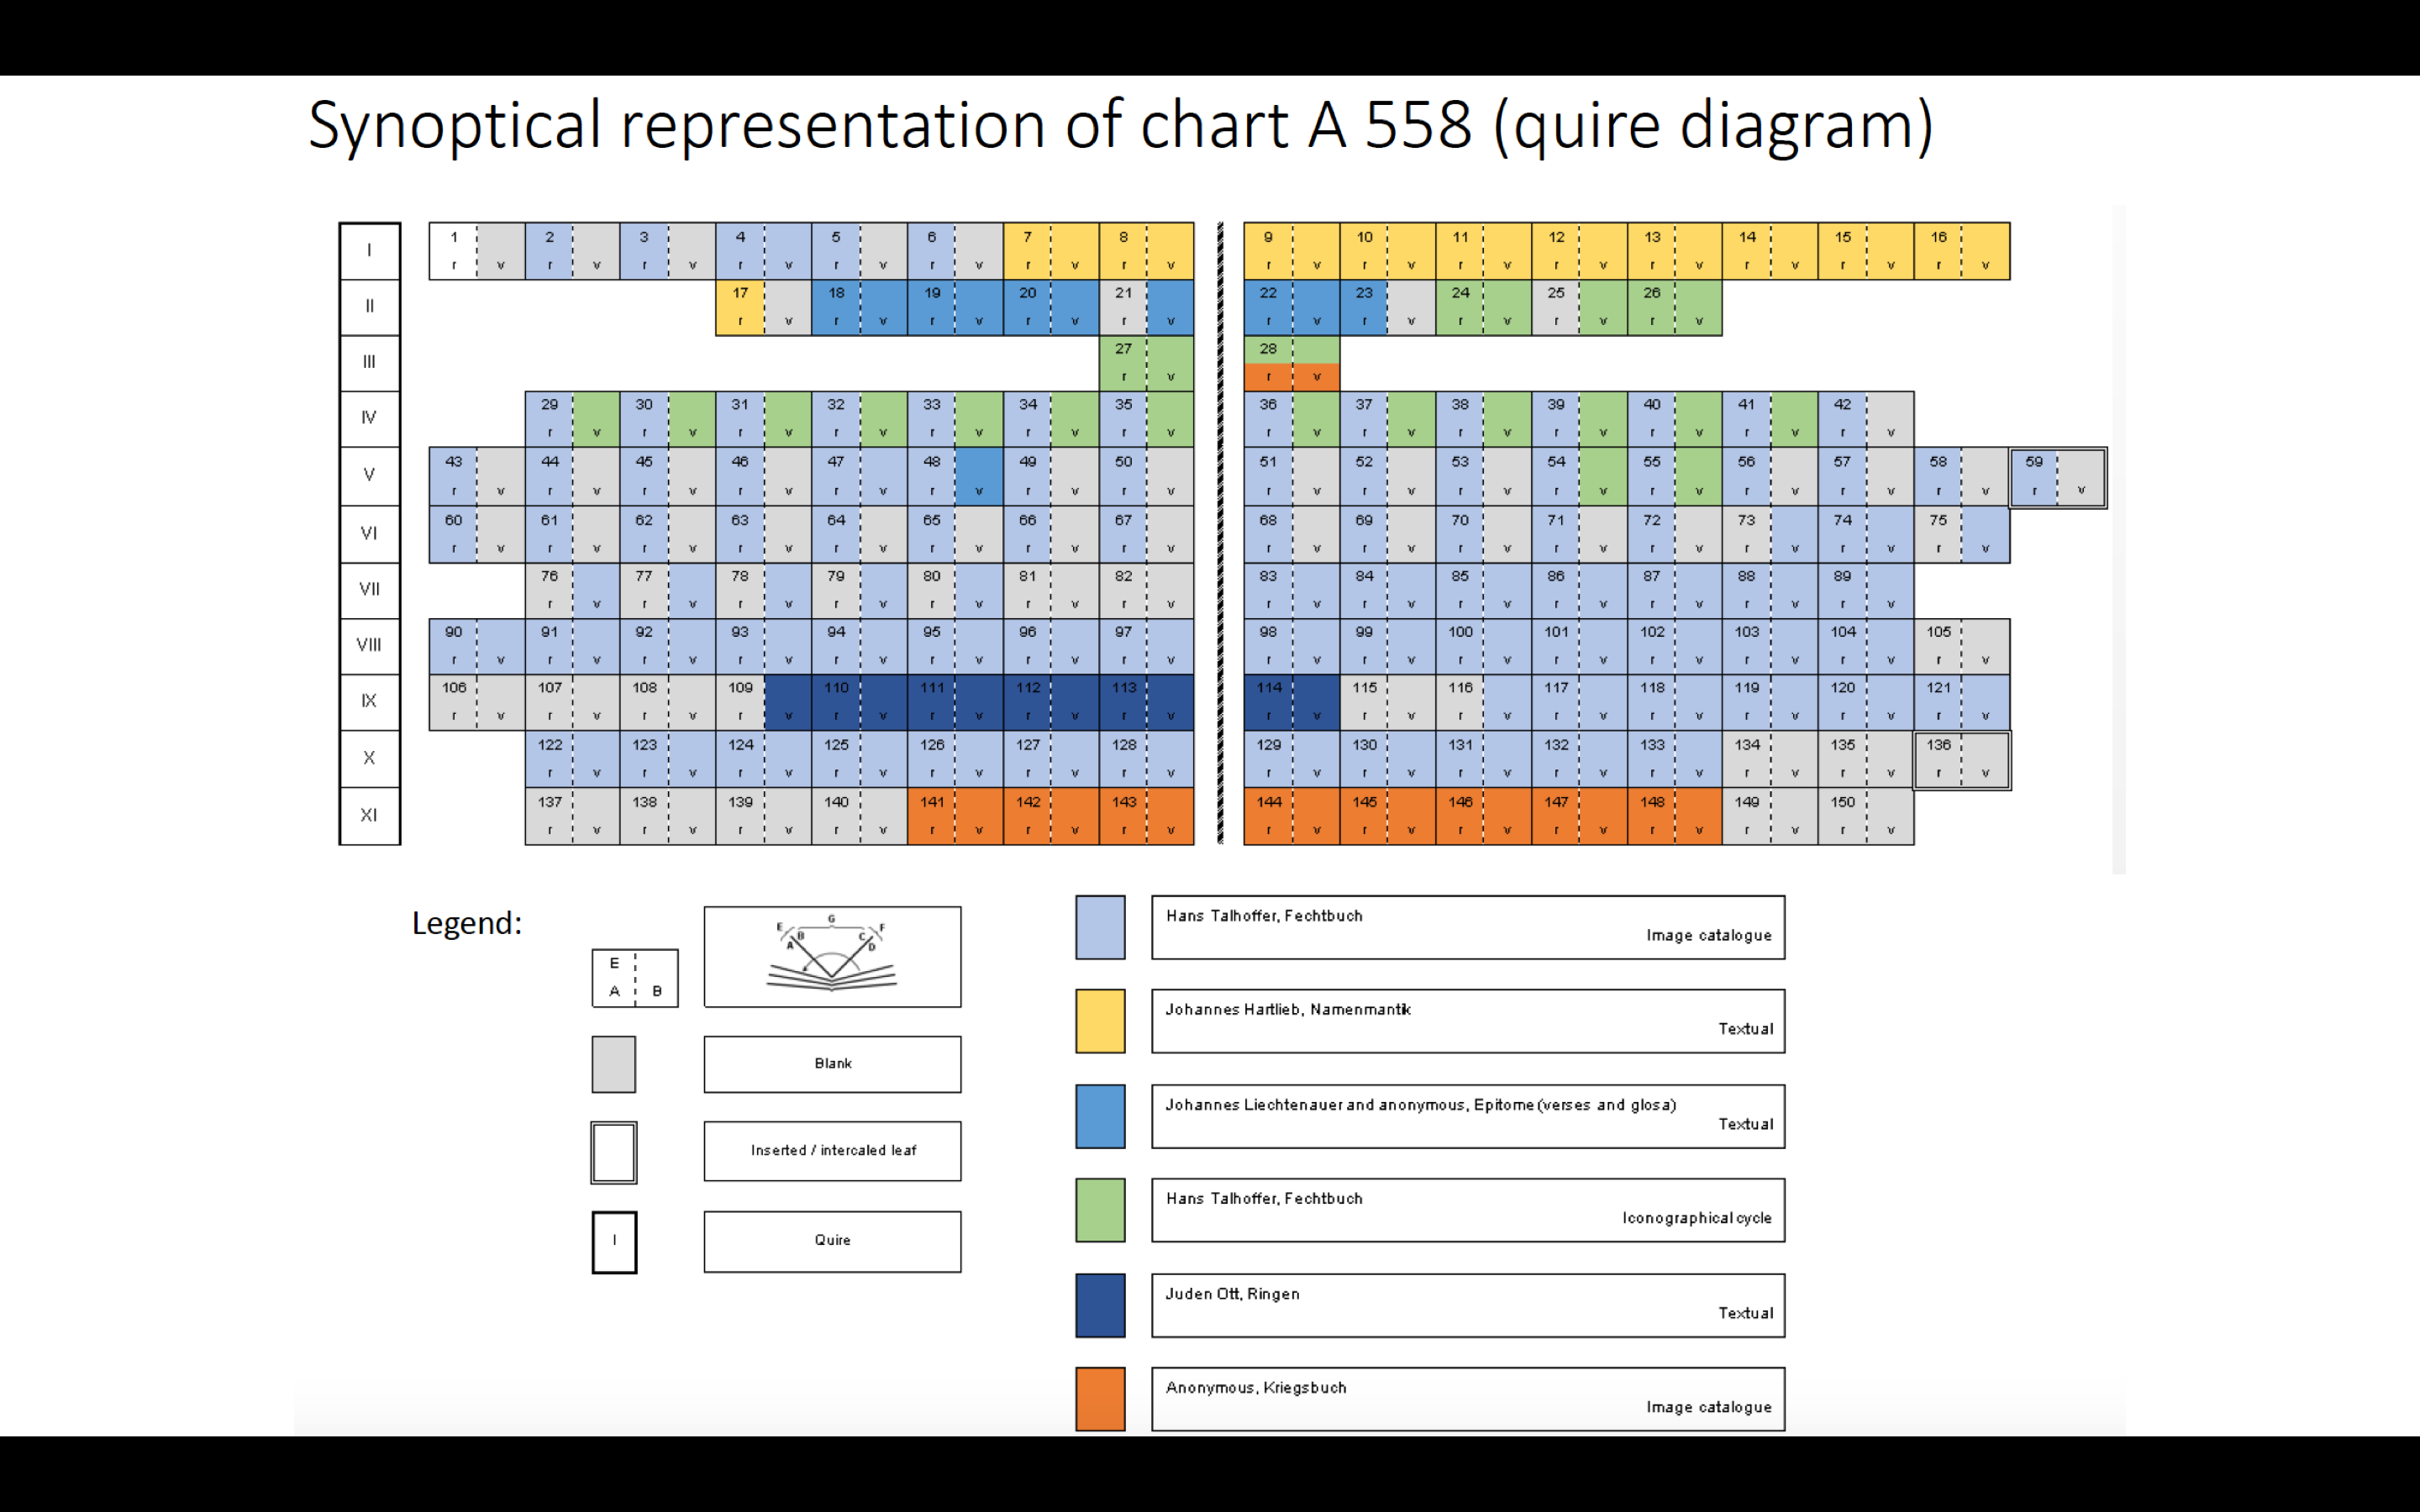
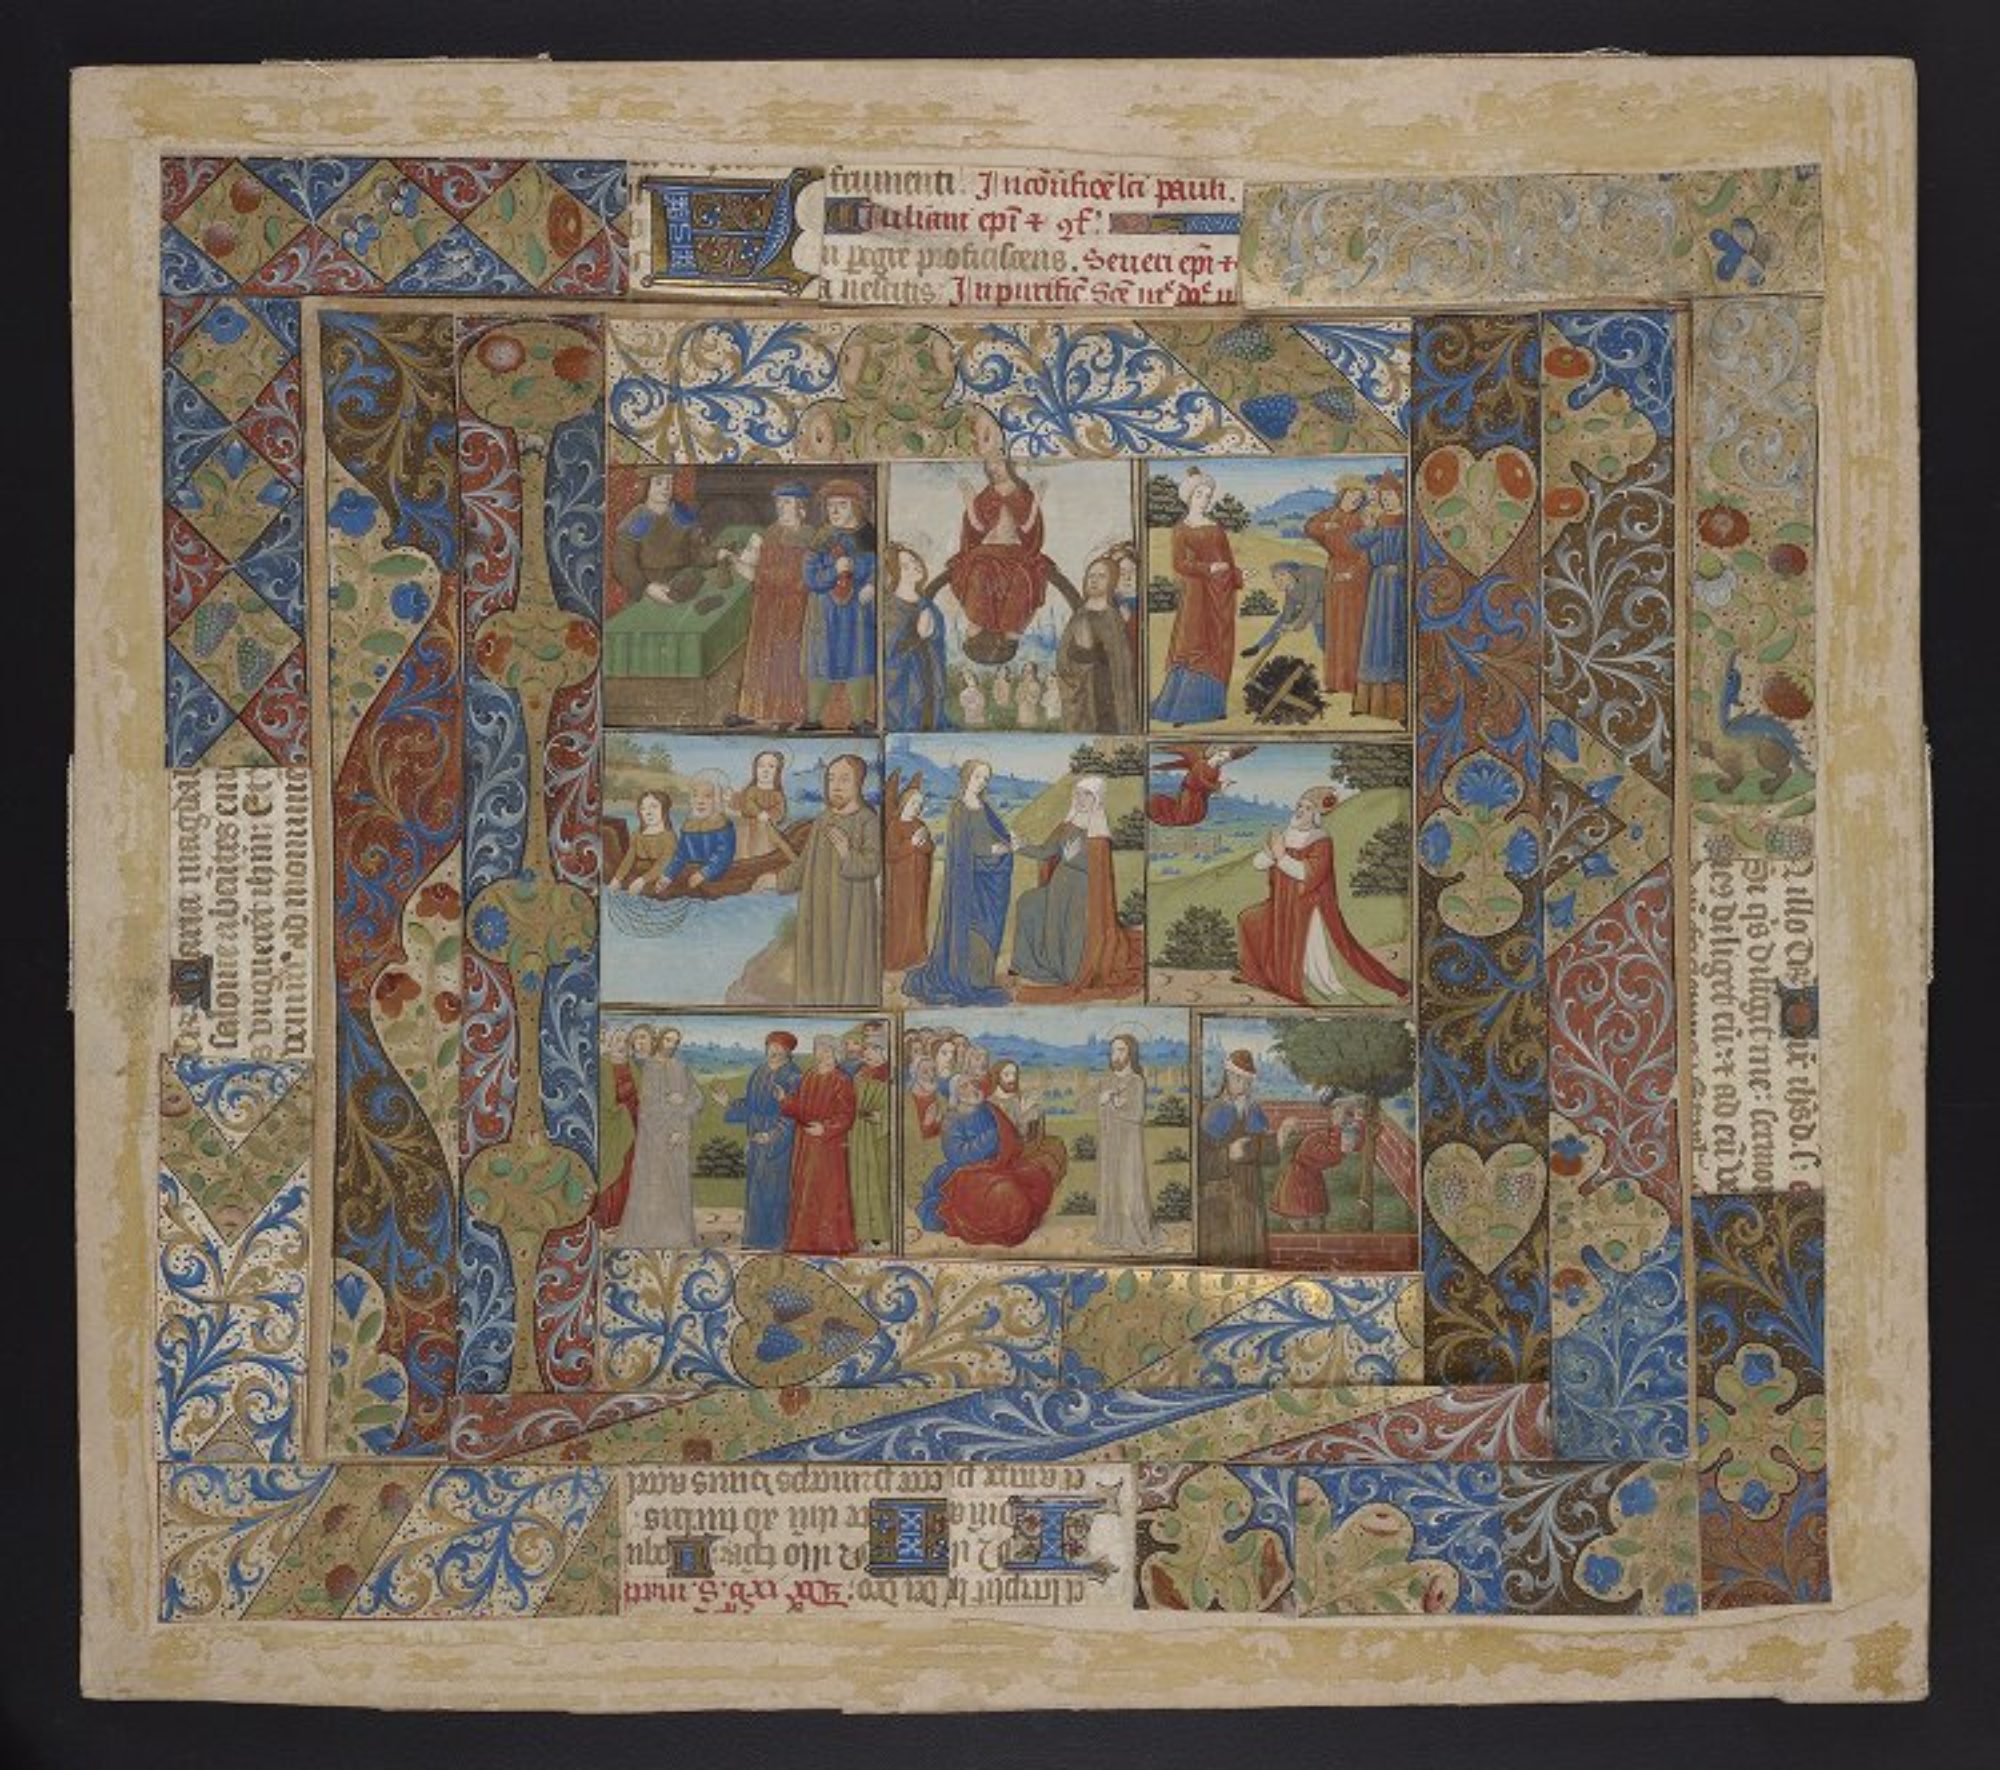
Building a system that considers a manuscript’s quiring in the display should be possible. We have the information (in the form of collation formulas), so we should be able to build processes to act on that. But of course it’s not that simple, because although a collation formula contains the information a person might need to construct a diagram of the codex, it isn’t formatted in a way that is able to be processed by a computer. It’s not an effective piece of data for a system of the type I describe above. The collation formula isn’t data, it’s a visualization of data, just one way to express the physical collation of a manuscript among many possibilities, and which visualization you choose will depend on what you want to do with it. For example, formulas work well in library manuscript descriptions or catalog records because they are compact and textual, while diagrams might be better suited for a scholarly essay or book because they can be annotated. There are other views one could take of the same information; I’m quite fond of this synoptic chart that shows how different texts and image cycles are dispersed through this miscellany.
However it takes work (both time and effort) to write formulas and draw diagrams and build charts. This is labor that doesn’t have to be repeated! What we need isn’t a formula, but a specially formatted, data-oriented description that can be turned into many different versions for different purposes.
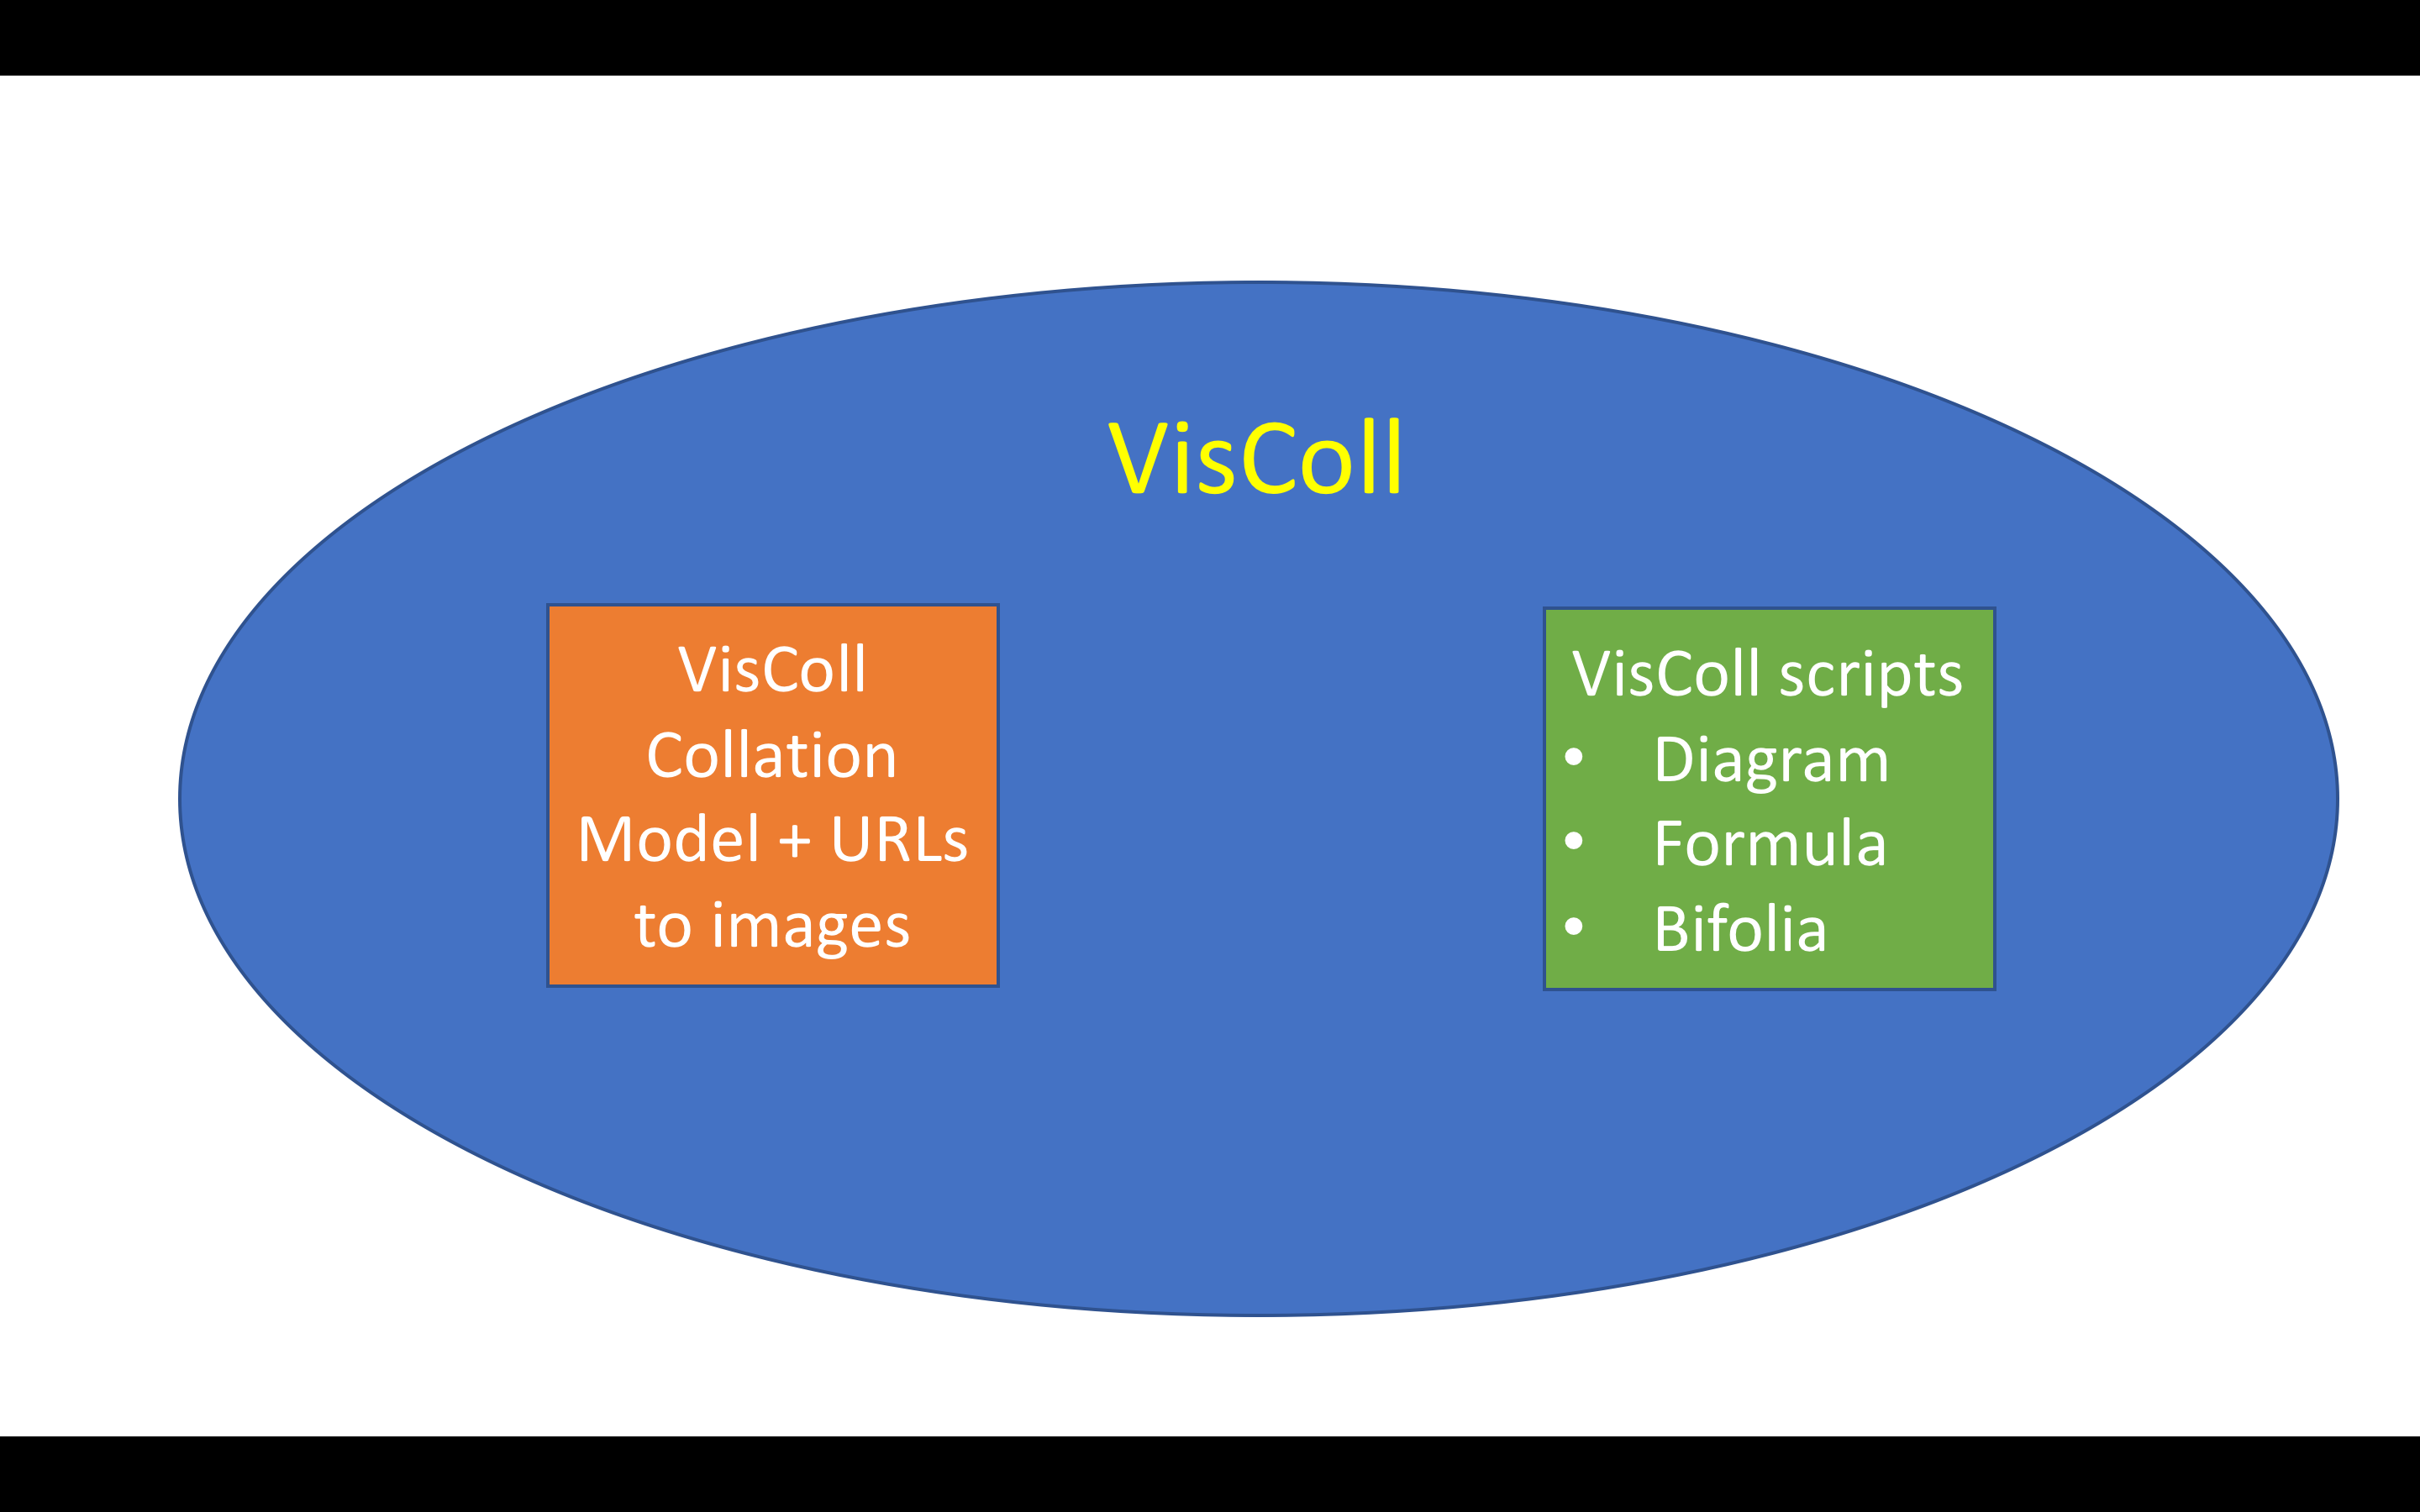
This is where VisColl comes in. Briefly, VisColl is a system that consists of a data model, which is basically a set of rules, that you can use as a guide to build collation models of manuscripts, and then scripts that you can use to process the collation model to generate different views of that model. We currently have three working scripts: one that generates diagrams, one that generates a presentation of leaves as conjoins (which we call the bifolia view – this view requires digitized page images) and one that generates collation formulas.
We are currently at an in-between stage with VisColl. We had a first version of our data model, and we have developed a second version but that one doesn’t have good visualizations yet, so today I’m going to talk about our first model, but I’m happy to answer questions about the second data model later.
The prototype of VisColl took collation formulas from The Walters Art Museum in Baltimore’s Digital Walters collection and generated diagrams directly from them. It was this prototype work that convinced me that generating data out of existing formulas was a terrible idea and would never work at scale. Nevertheless, I decided that the first step in my experiment would be to attempt to parse the collation formulas in Parker on the Web and convert them into XML files following the rules for our collation models. I wrote scripts to pull the formulas out of the Parker records and got to work figuring out rules that would describe the conversion from formula to XML. As I spent a few hours on this, I was reminded of why we decided to move from processing formulas to creating new models in the first place.
The collation formulas in Parker on the Web are inconsistent (this is not a criticism of Parker on the Web – the formulas come from different catalogues created over time by many different people, with no shared guidelines. The same thing would happen in any project that combines existing catalogs). Unlike with printed books, there is no standard for manuscript collation formulas, and the formulas in Parker on the Web have a lot of variance among them, notably that some use Arabic numerals, some Roman numerals, and some letters, while some describe flyleaves as quires and some do not. Because of the inconsistency, it was very difficult to get a handle on every single thing that would need to be caught by a process in order to convert every detail of a formula into an XML model. The use of letters, Arabic numerals, and Roman numerals is one example. In order to identify quires I would need a script that would be able to interpret each of these, to recognize when a quire identified by a letter was a set of flyleaves and when not, and to be able to generate multiple quires when presented with a span of numbers or letters.
It is possible that this is something that could be done, given enough time and expertise, but given my constraints I was clearly not going to be able to do it myself for this talk. So instead, I turned to the Collation Modeler, which is the tool that we use at Penn to build models from scratch. (Another implementation of VisColl is being developed as part of the Digital Tools for Manuscript Study project by the Old Books New Science Lab at the University of Toronto)
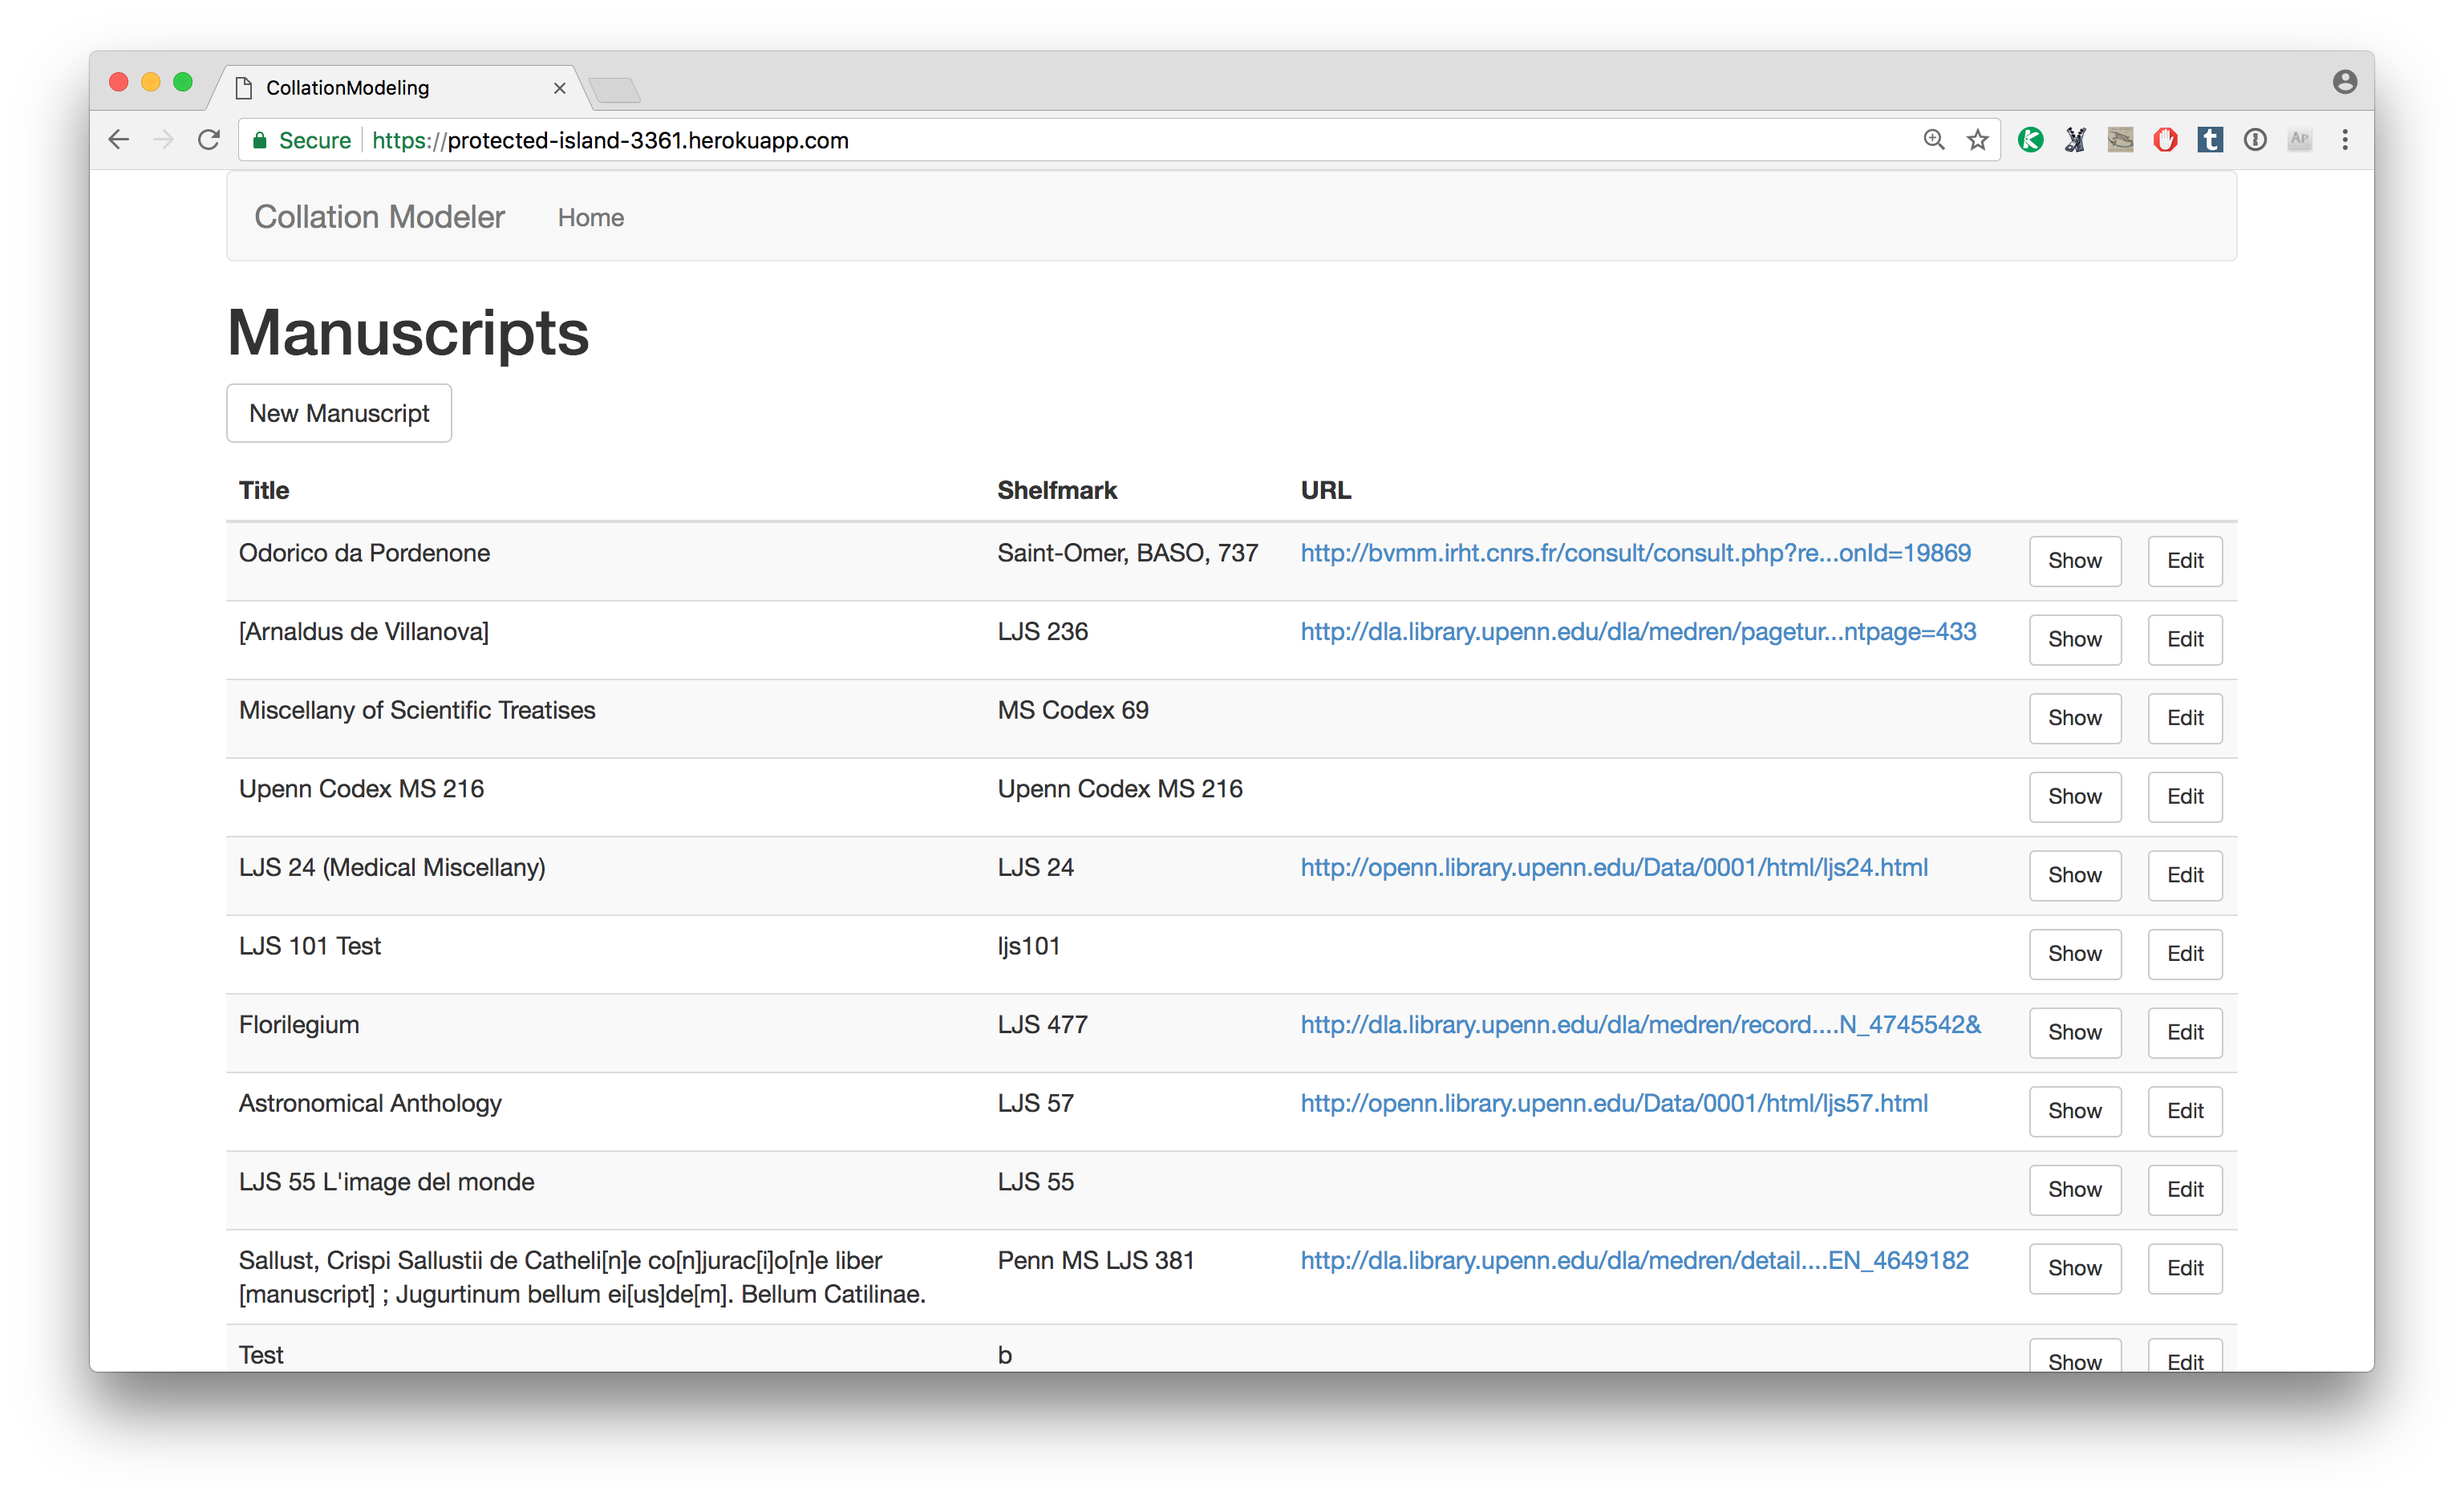
If you have a collection formula to work from its actually pretty easy to build a model for it in the Collation modeler.
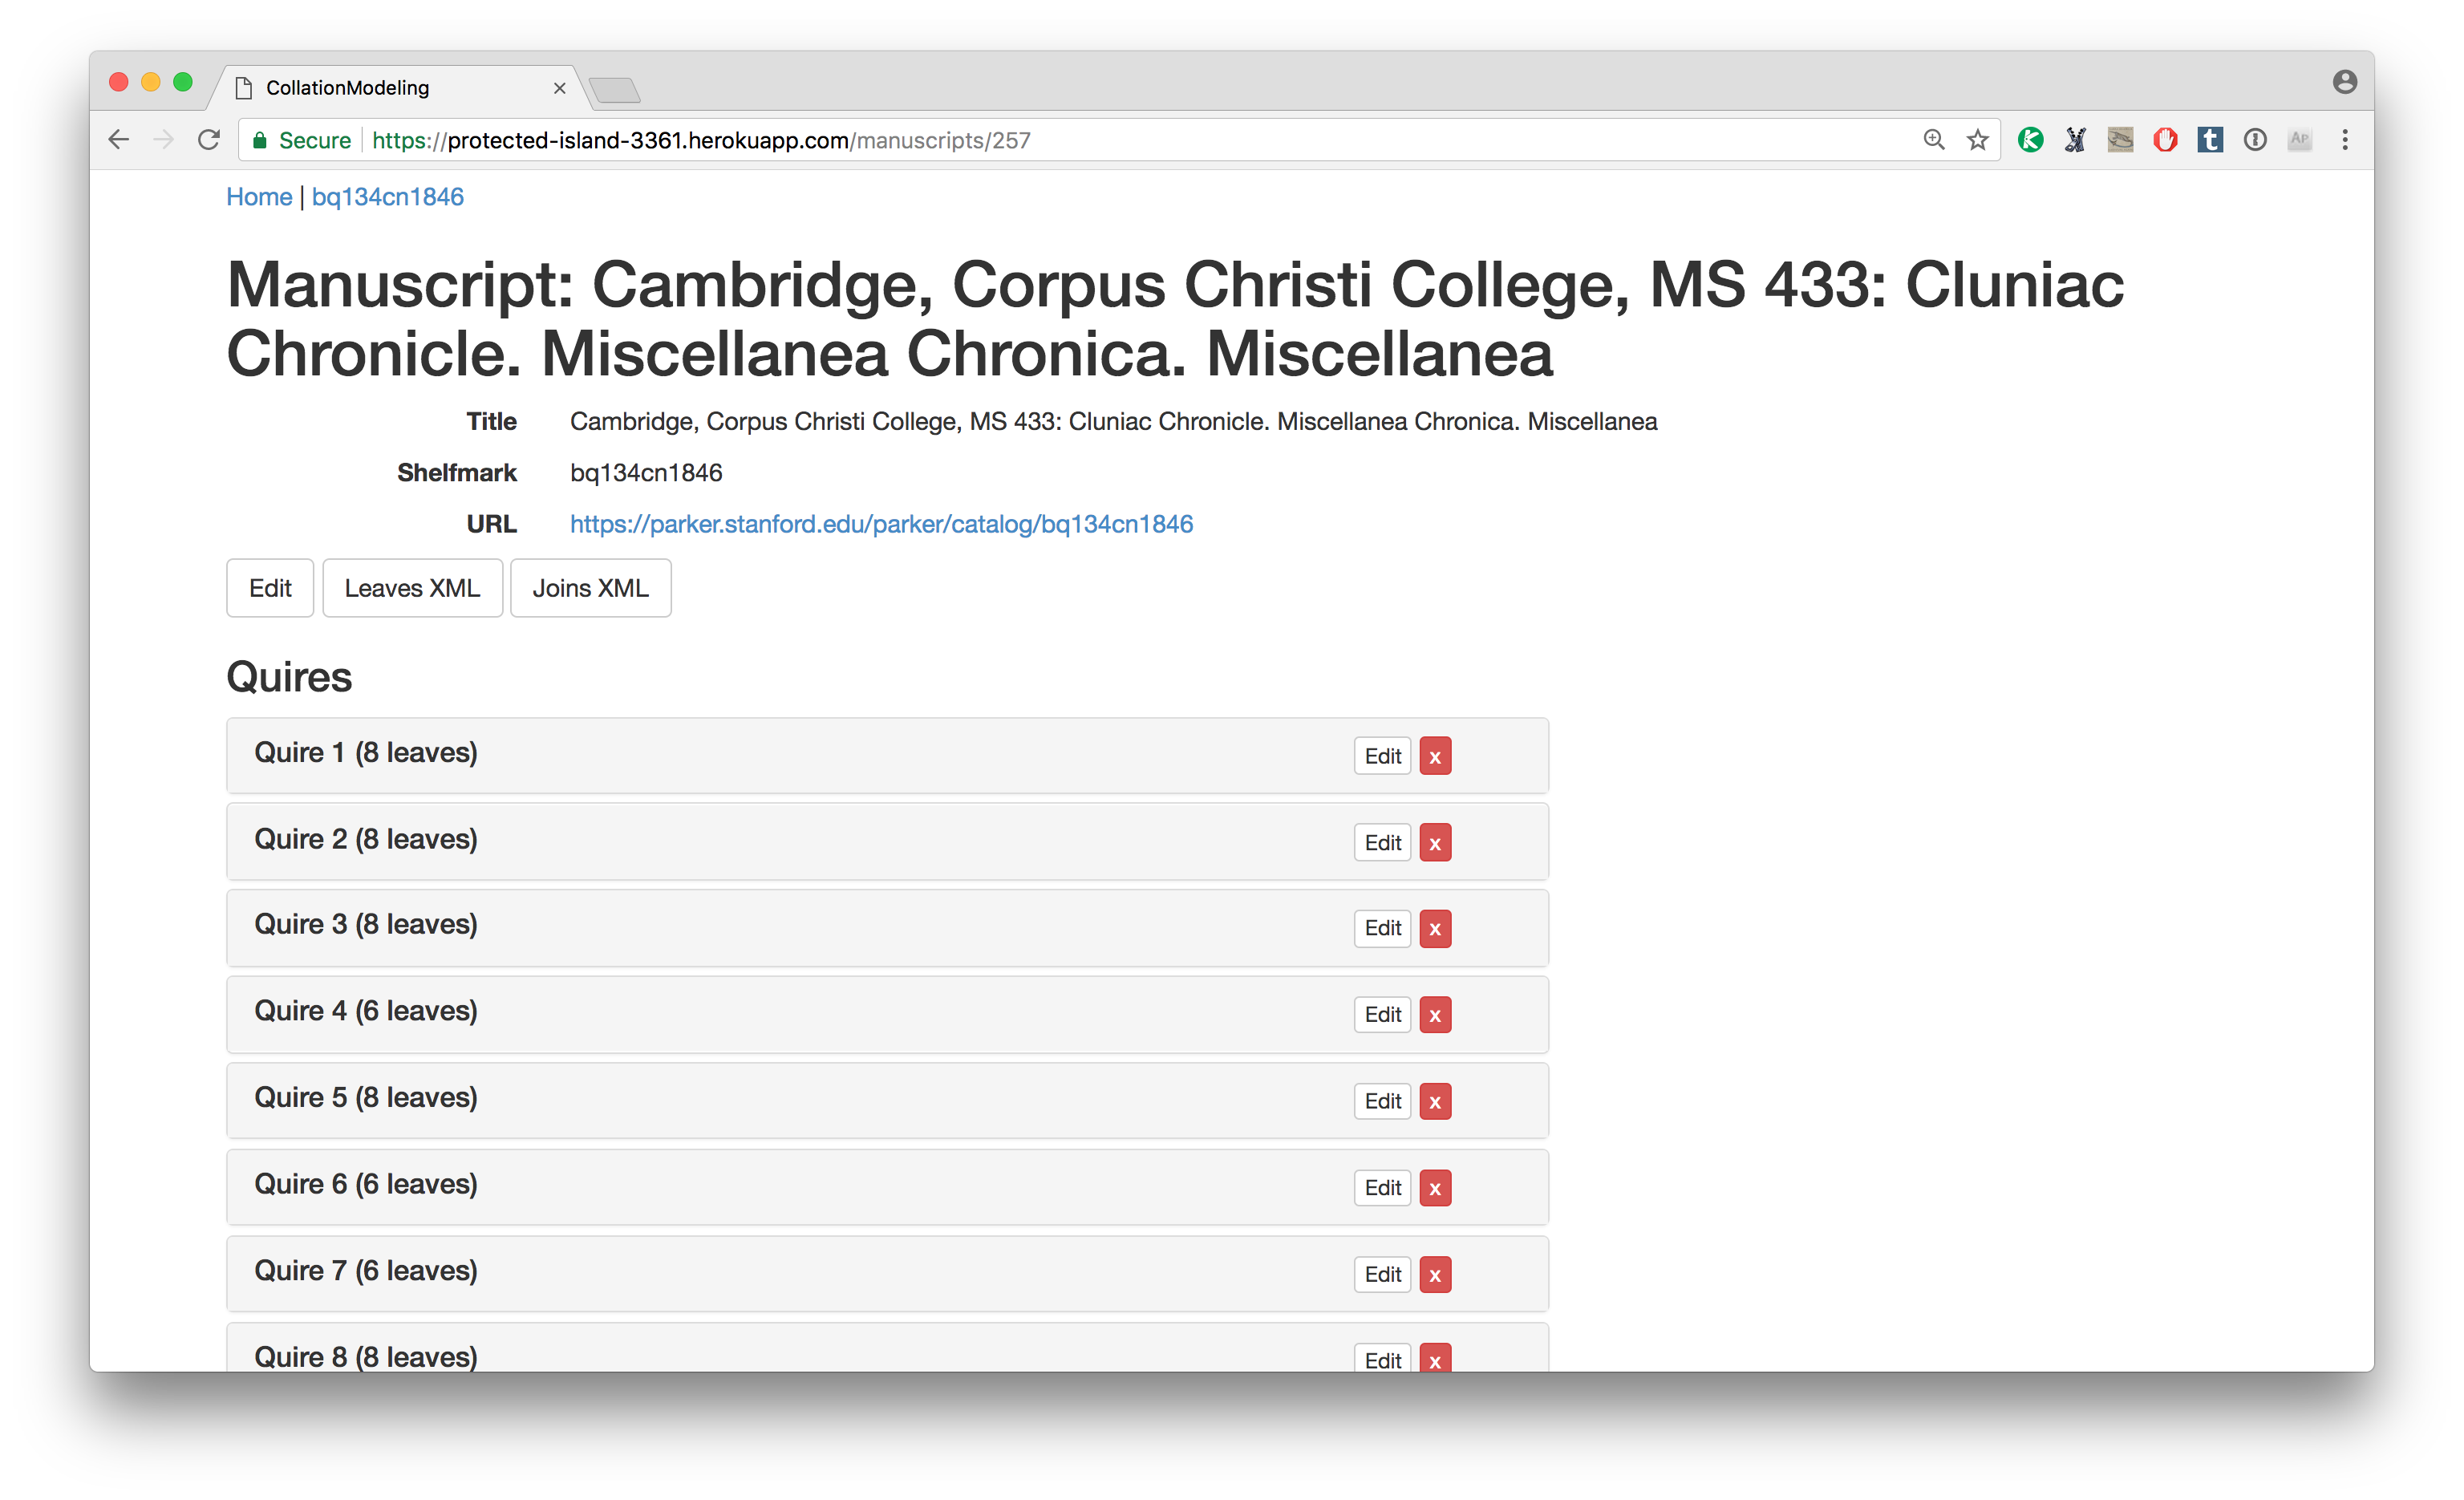
Here is MS 433 again, in the context of the collation modeler. Here in the main manuscript page, I’ve listed out all the quires in the manuscript and you can see the number of leaves in each. Using the collation modeler I can generate multiple regular quires all at once and then modify them, or create quires one-at-a-time. Folio numbers are generated automatically, but if the manuscript is paginated I need to change the folio numbers to page numbers (formatted as two numbers separated by a dash); to make this easier I wrote a script to fix the numbering in the finished collation model rather than doing it in the modeler (pagination will be built into the system for the new data model).
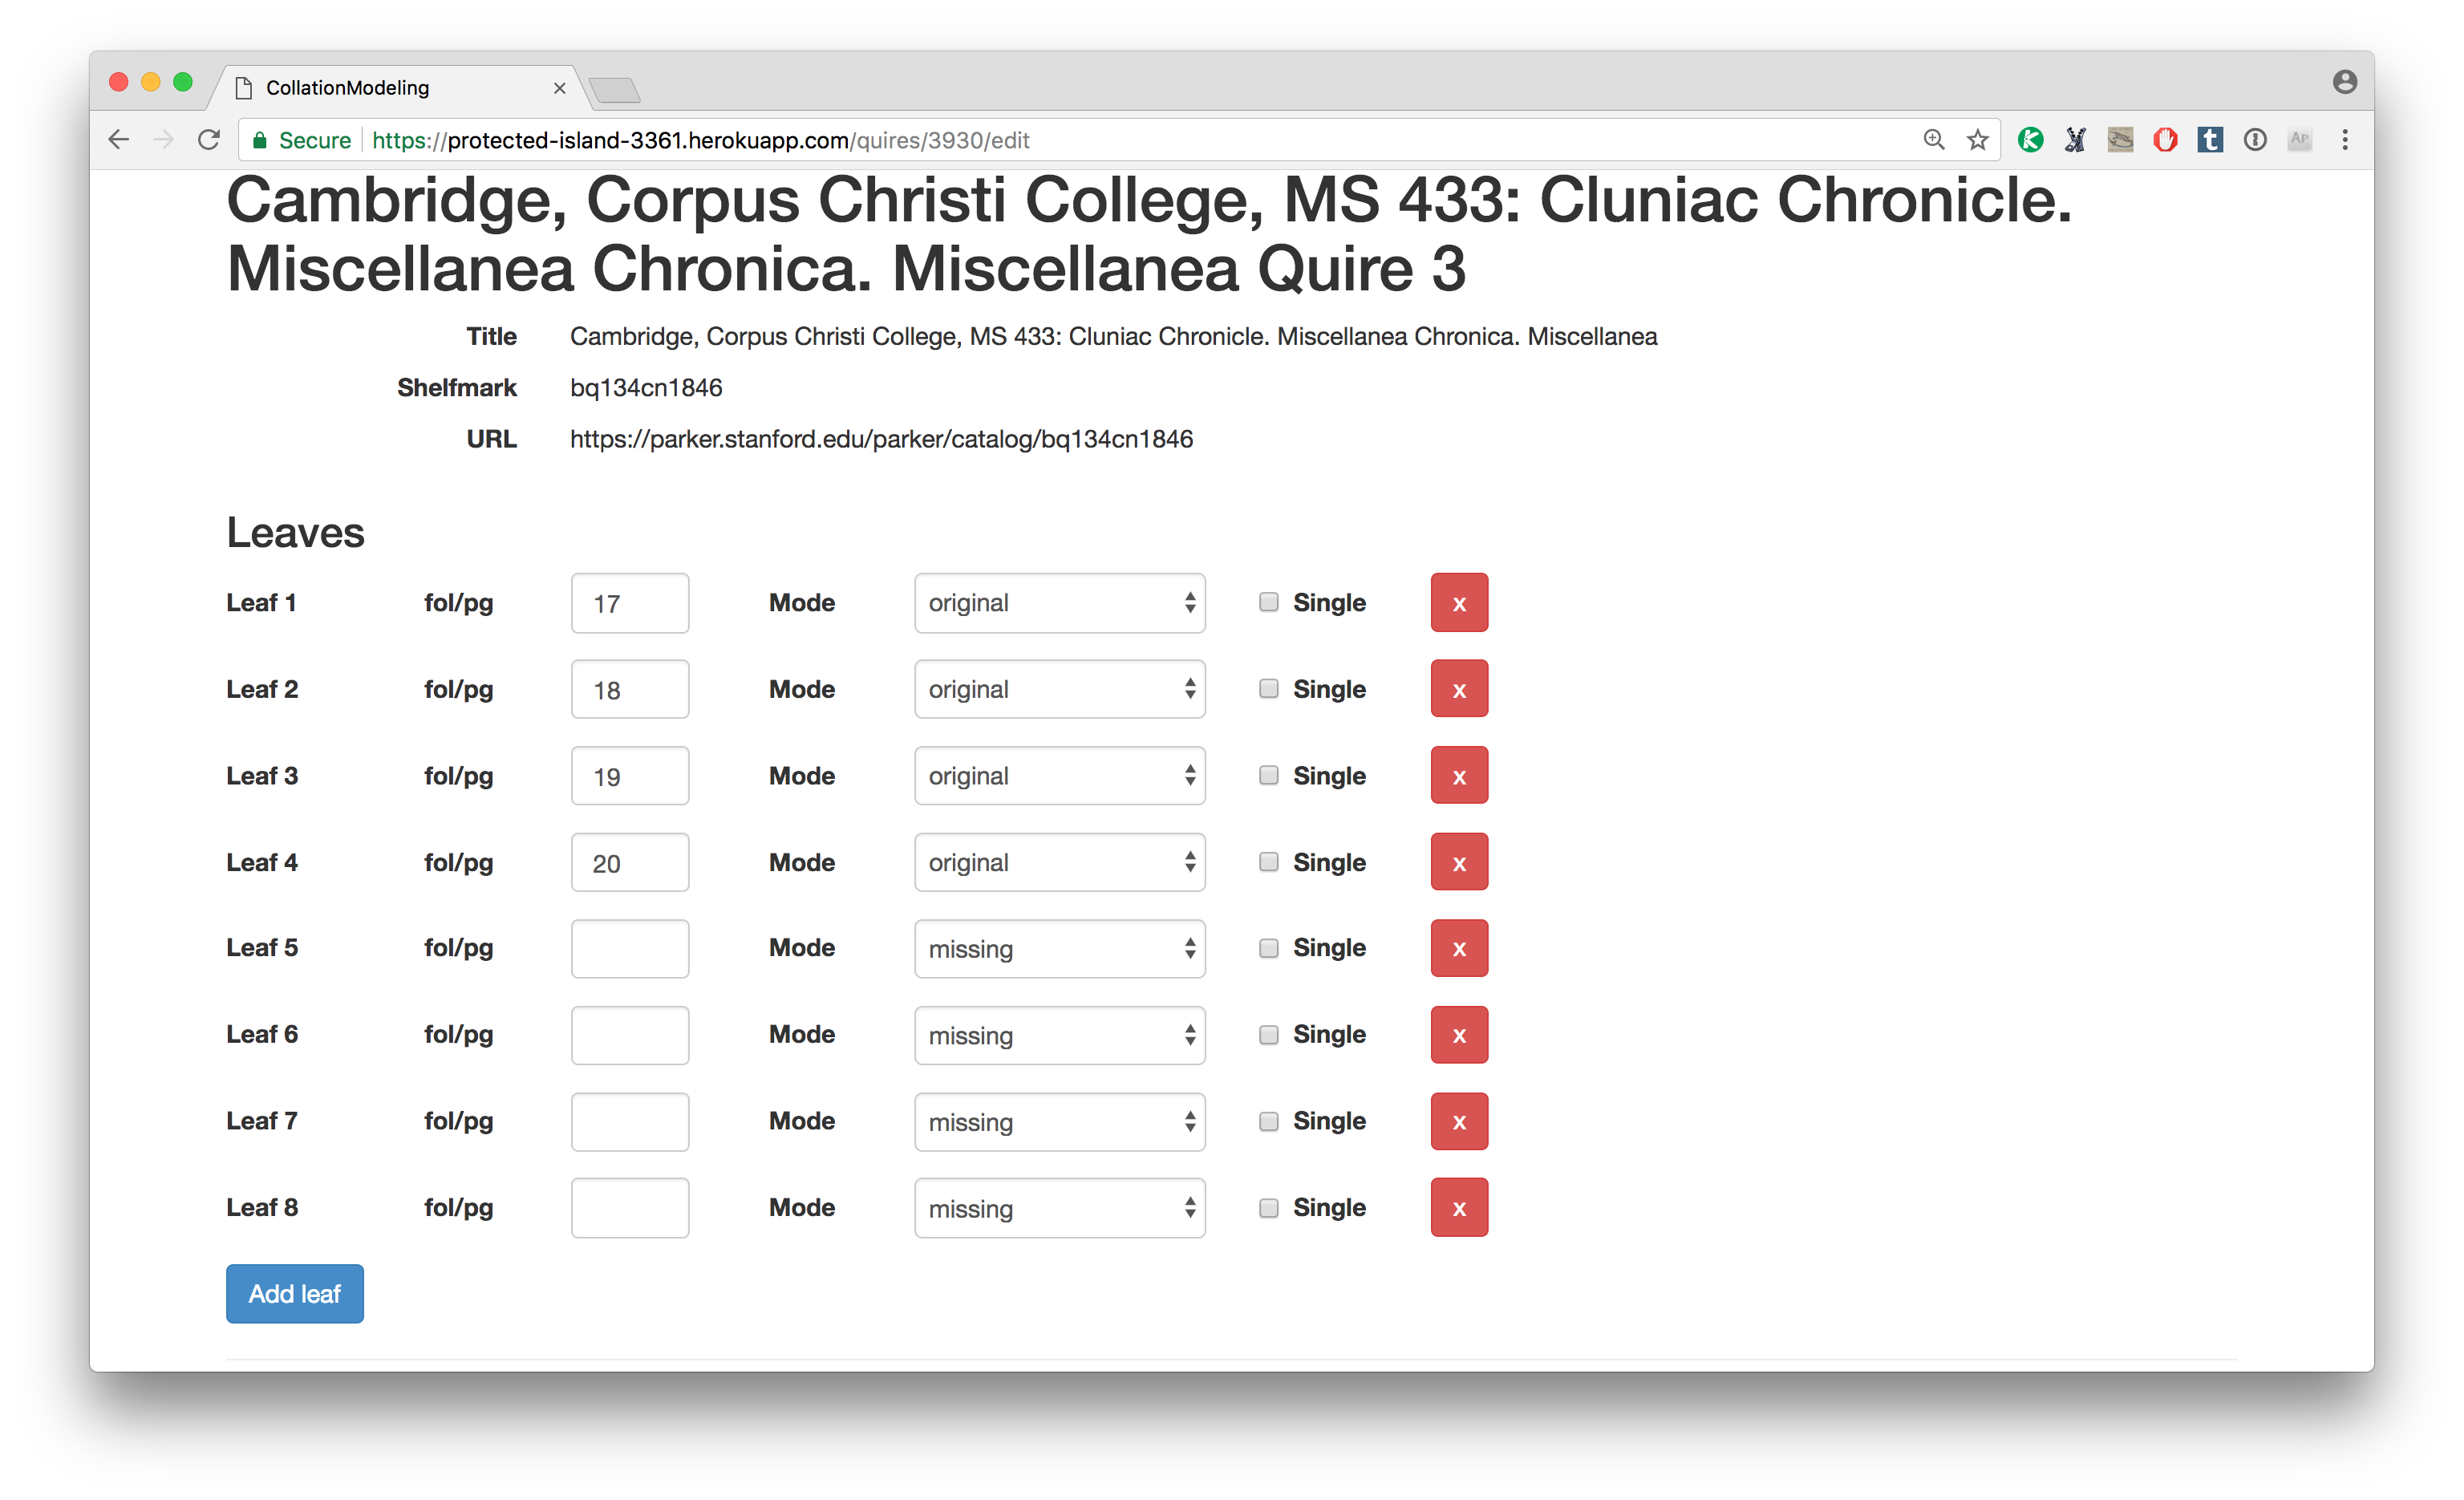
Taking a look at Quire 3, we can see the list of leaves, the folio numbering (which again I can change – we can also renumber completely from any point in the manuscript, if for example the numbering skips a leaf or numbers repeat). We can also note the “mode” of a leaf – is it original to the manuscript, added, a replacement, or missing? Once the model is built in the collation modeler, I output the collation model, which is an XML file.
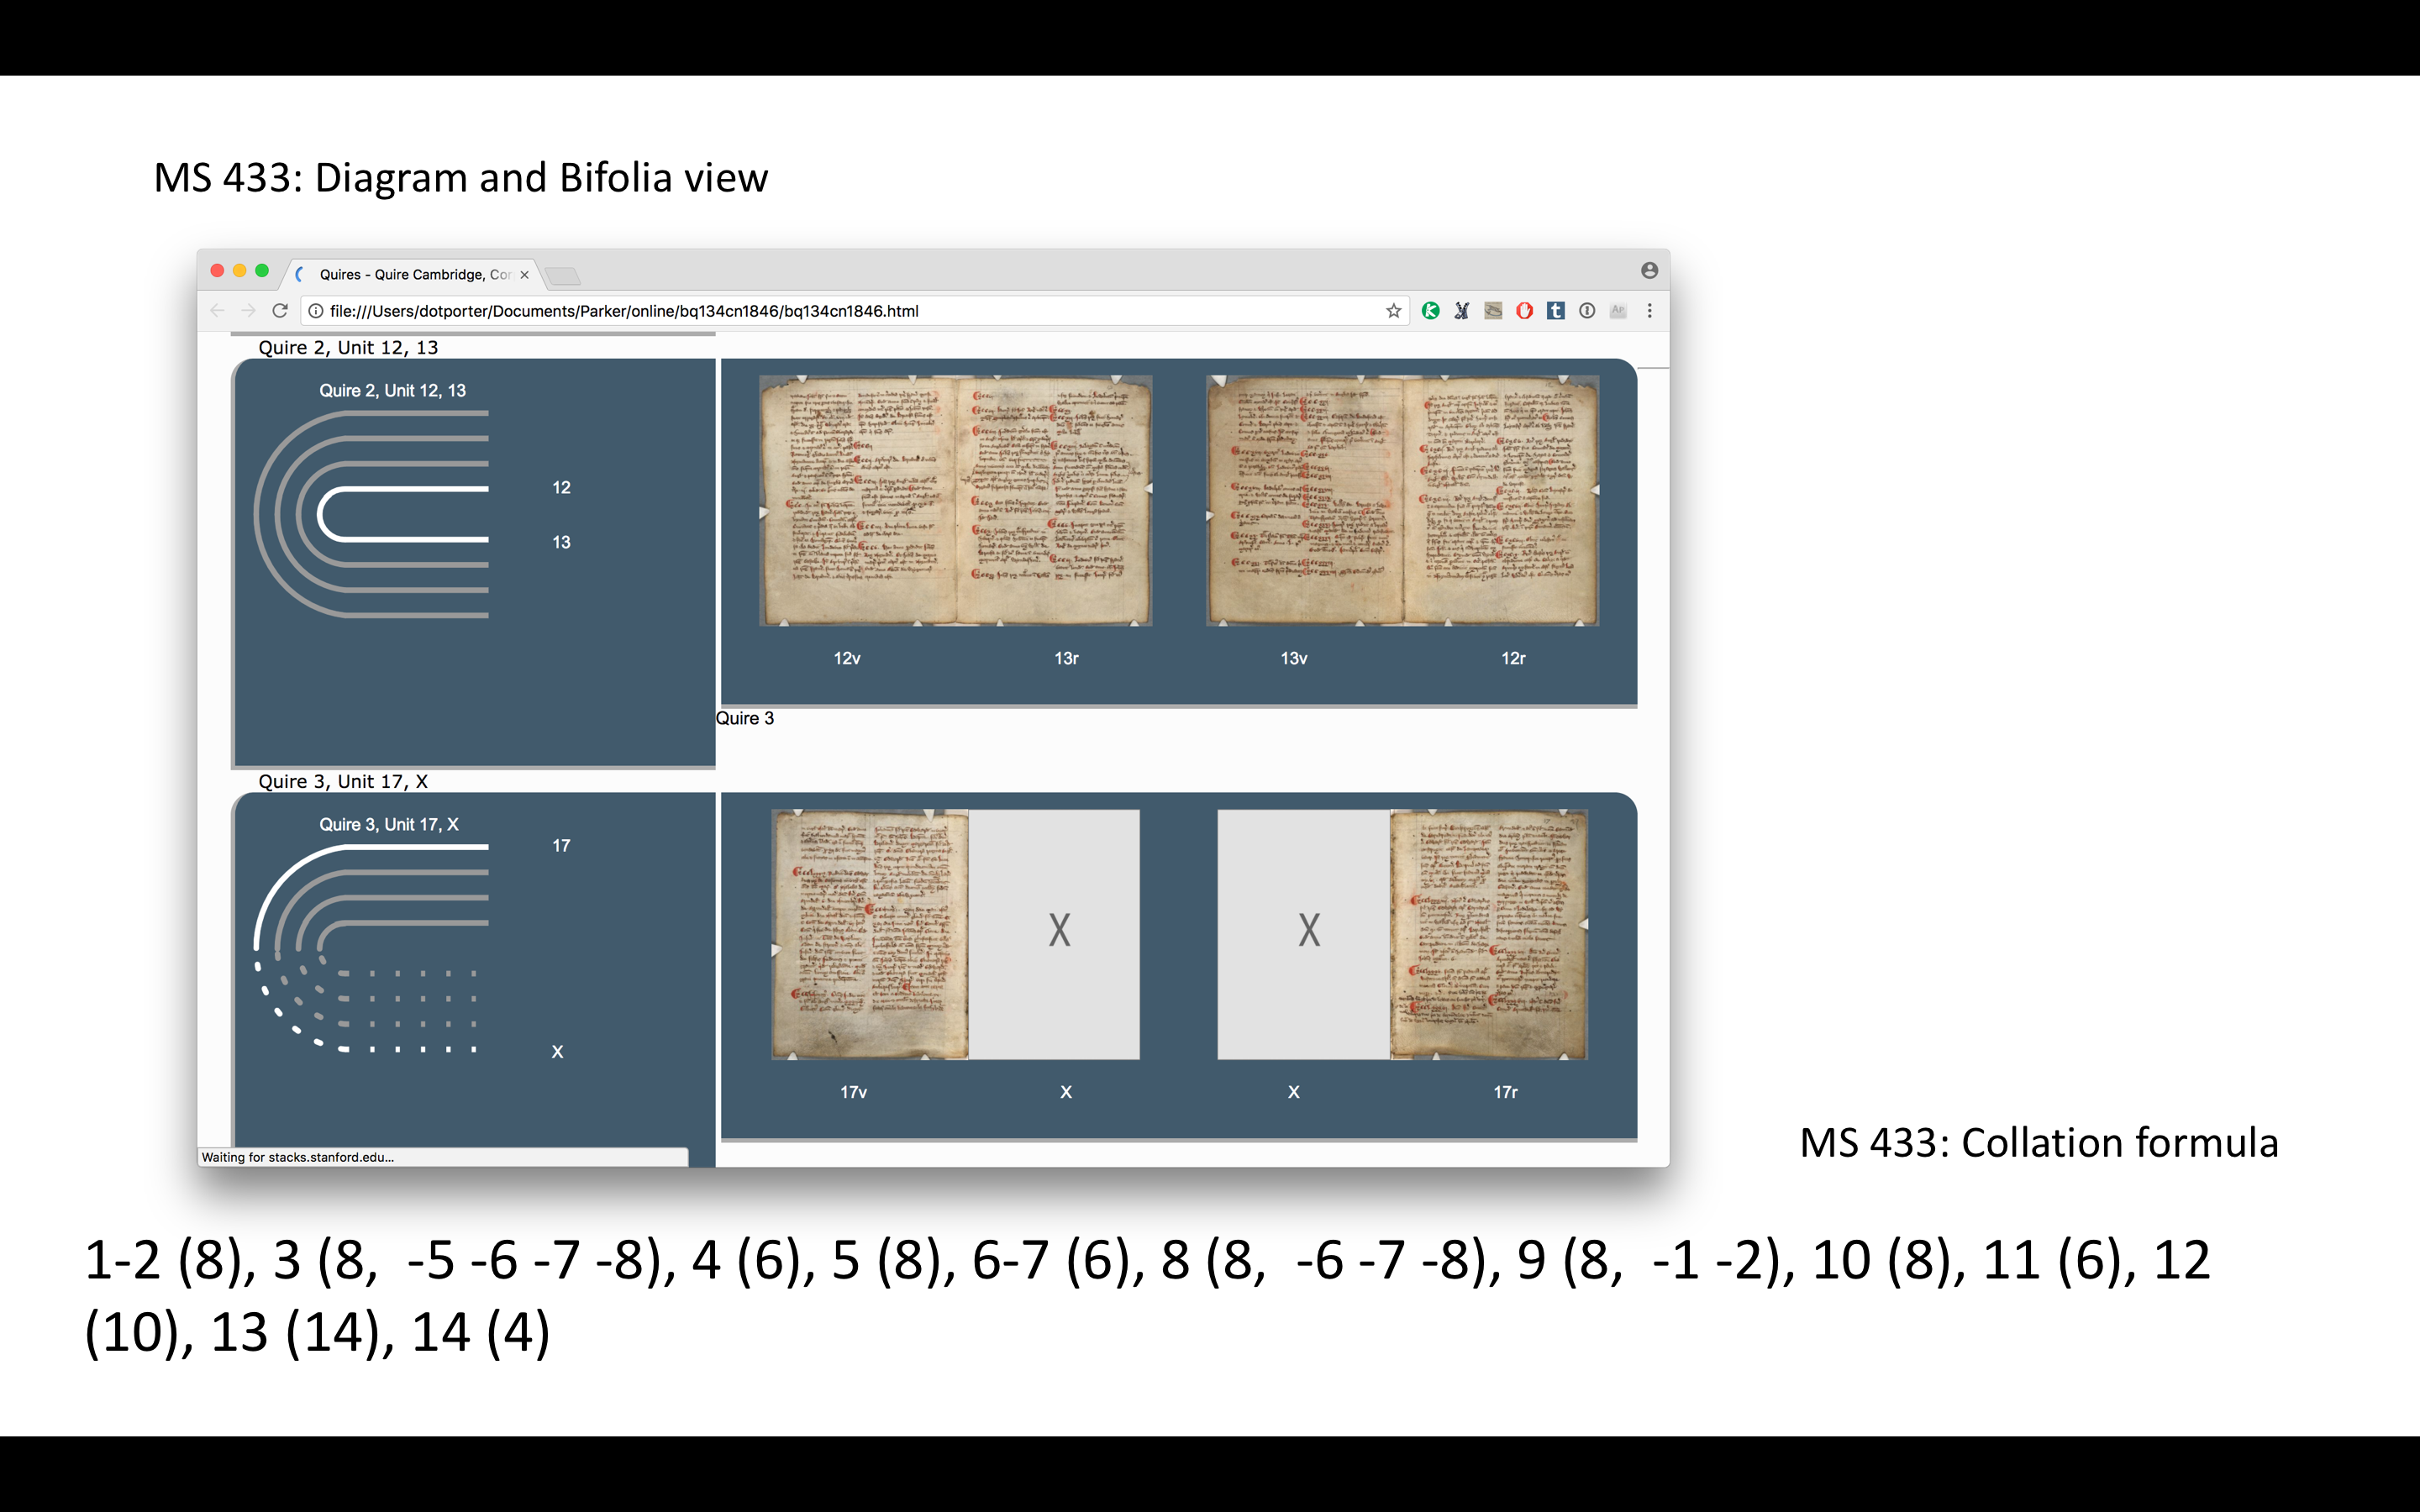
And then I processed this model using the existing scripts and got diagrams, bifolia view, and a collation formula (the script actually generates a set of formulas – we can generate as many different flavors of formula as we need). You will note that the formula isn’t exactly like the formula from the record.
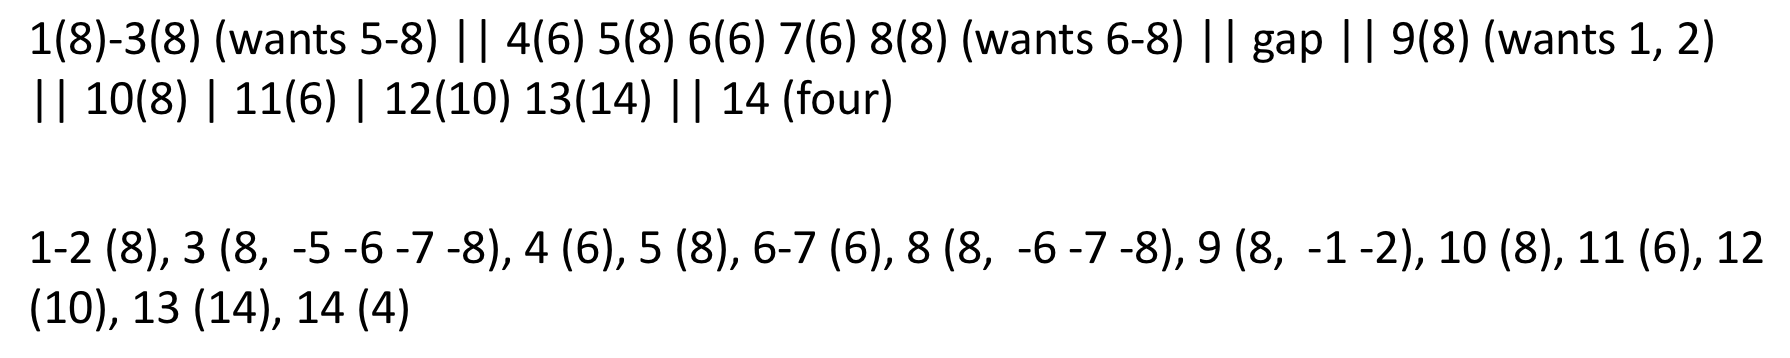
That’s because the first data model is very simple and doesn’t indicate advanced things like gaps or quire groupings (indicated by “gap” and || dividers in this formula). This is actually something that can be done in the second data model, so hopefully by the end of the summer we’ll be able to output something that looks more like the record formula, and also include that information with the diagrams and bifolia view.
Once I decided to forego processing the formulas, work progressed more quickly. I was able to get 21 formulas into the collation modeler within a few hours spread out over two days. In addition to referencing the formula I would also reference the folio or page numbering in the manuscript description (which describes when page numbers are missing, repeated, or otherwise inconsistent), and at times I would reference the image files too (although I did that to double-check numbering, not to seek out physical clues to collation).
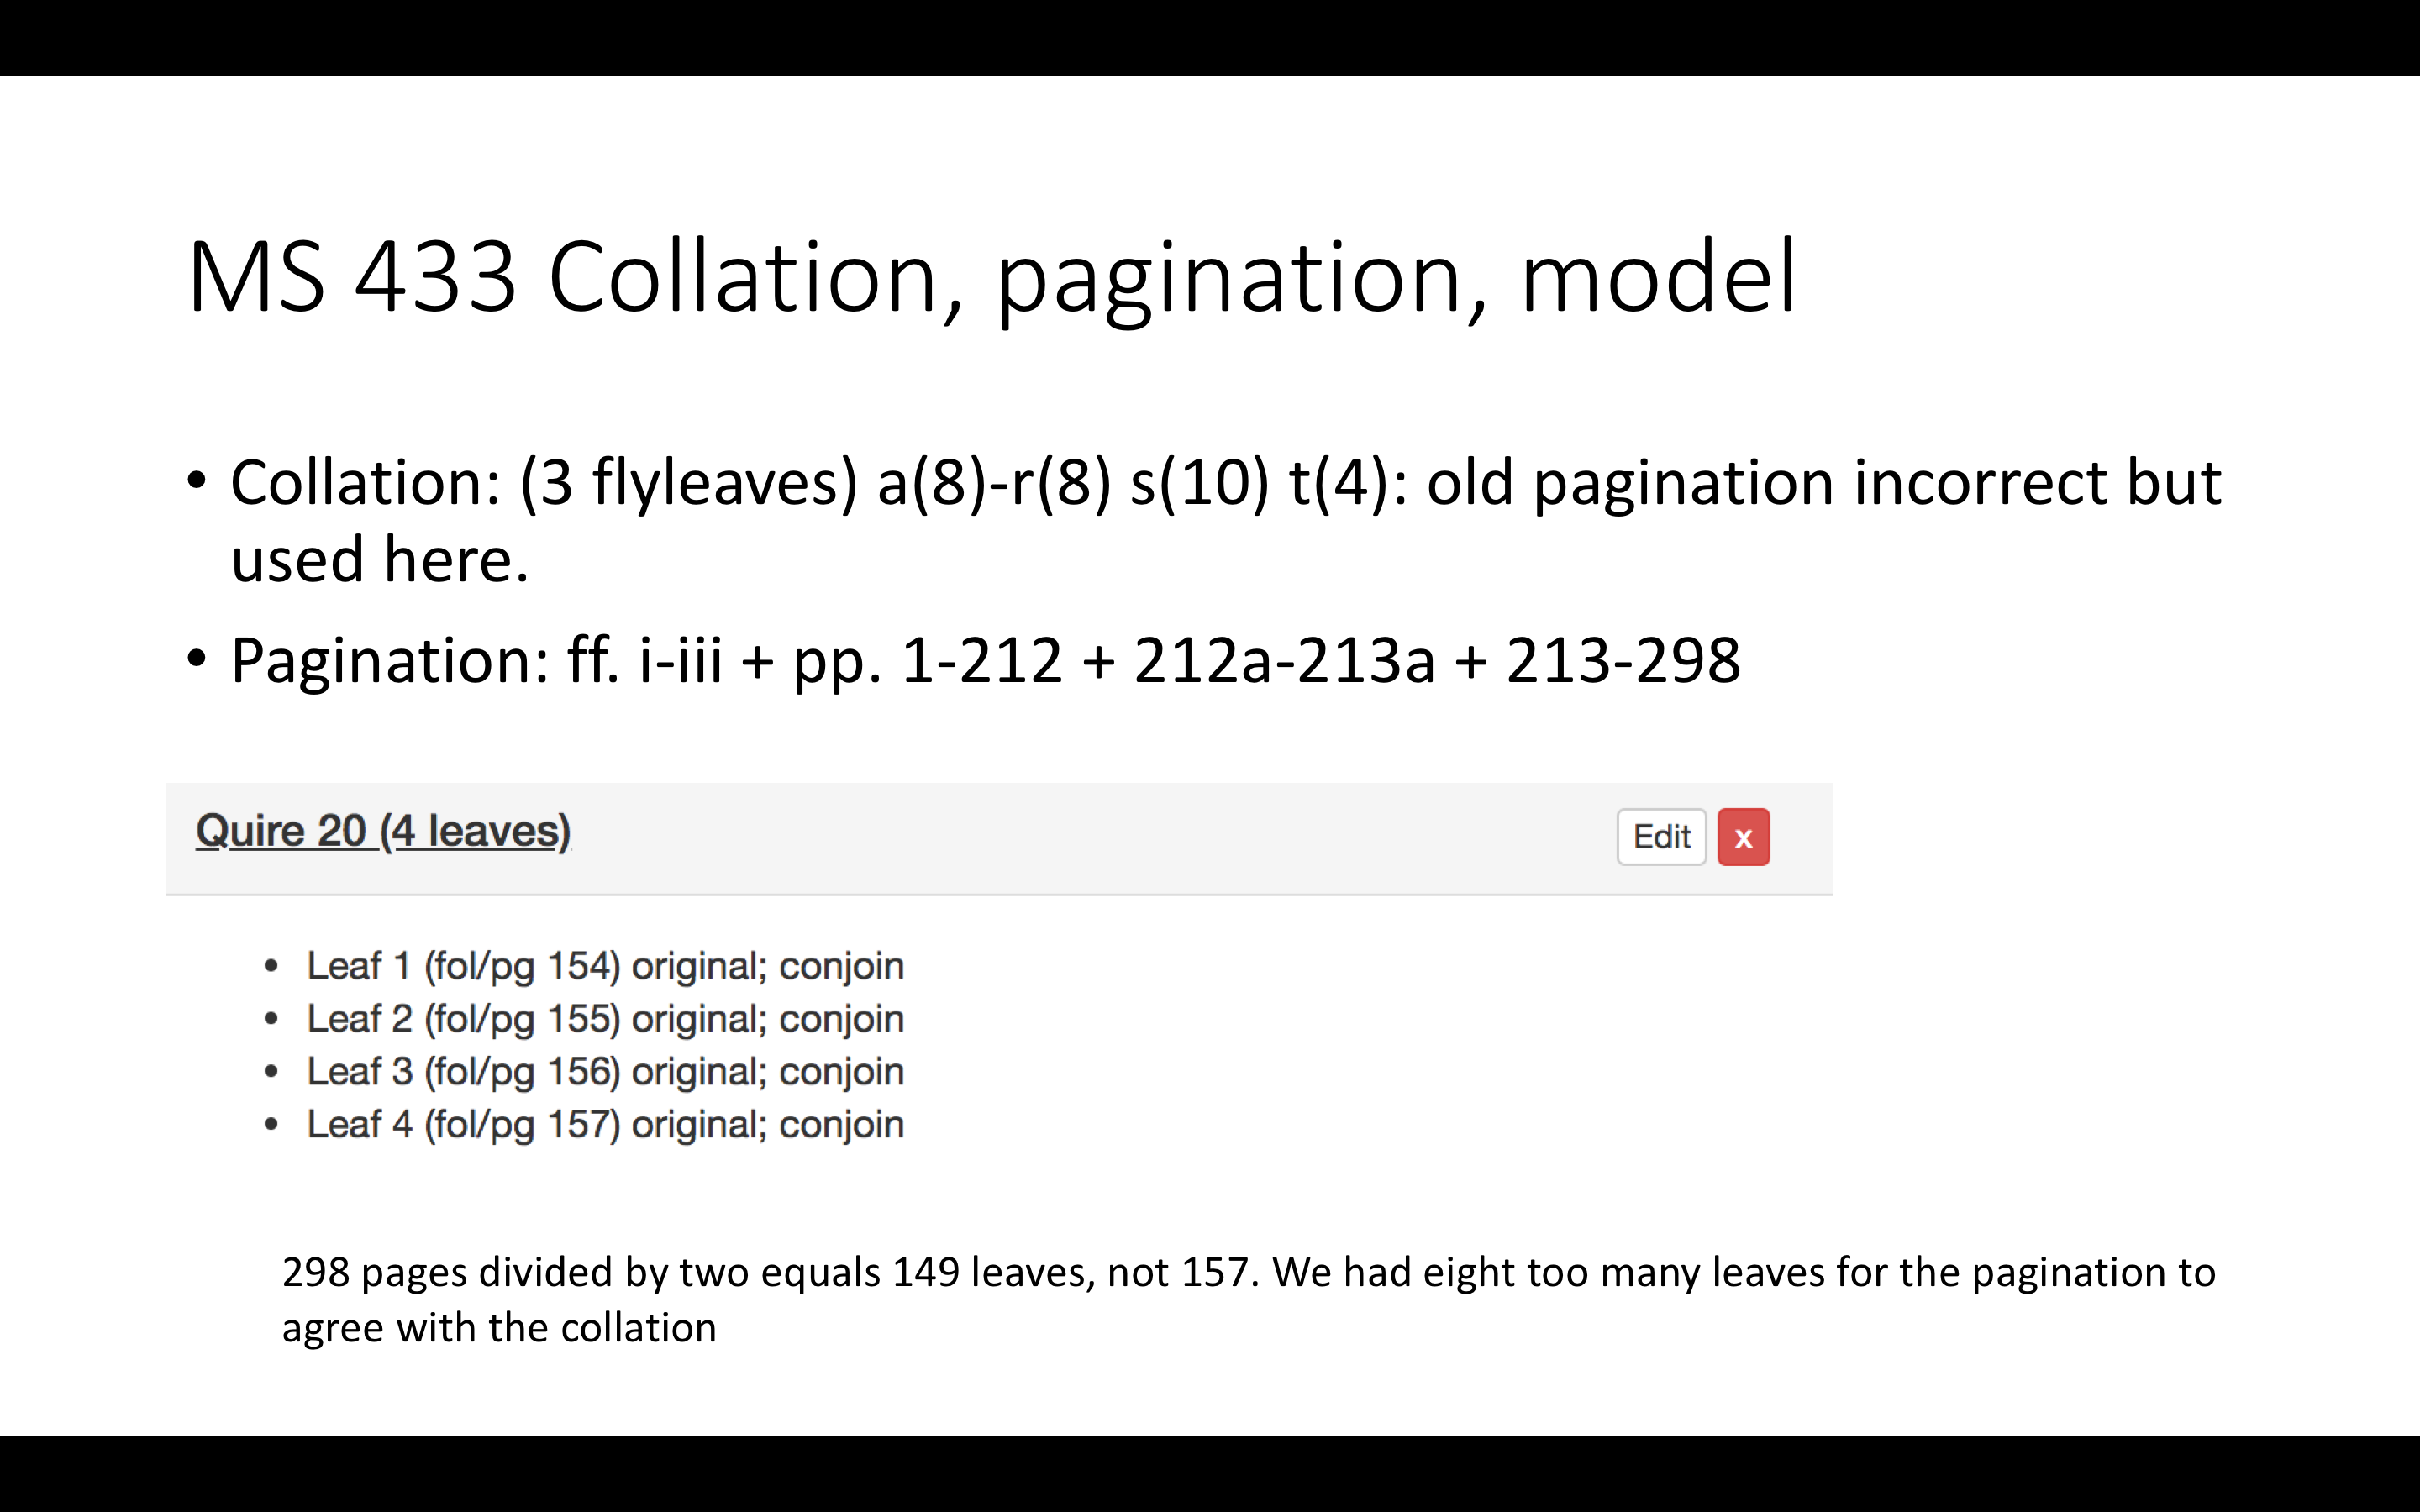
Work slowed down again when I discovered while entering the data that in several cases the foliation or pagination given in the record didn’t agree with the numbering required by the given collation formula. In the Collation Modeler you specify which folio or page aligns with which leaf in a quire – there should be a 1:1 correspondence between foliated leaves or pairs of paginated pages and leaves listed in the collation model. The first time I noticed this, a manuscript with several regular quires of 8 ended up with 8 more leaves required by the formula than were accounted for in the manuscript description. I figure that the person who made the formula got caught up in the regular quires and just added an extra one to the count, so I was comfortable removing one quire of 8 from the model. It’s not always this clear, however.
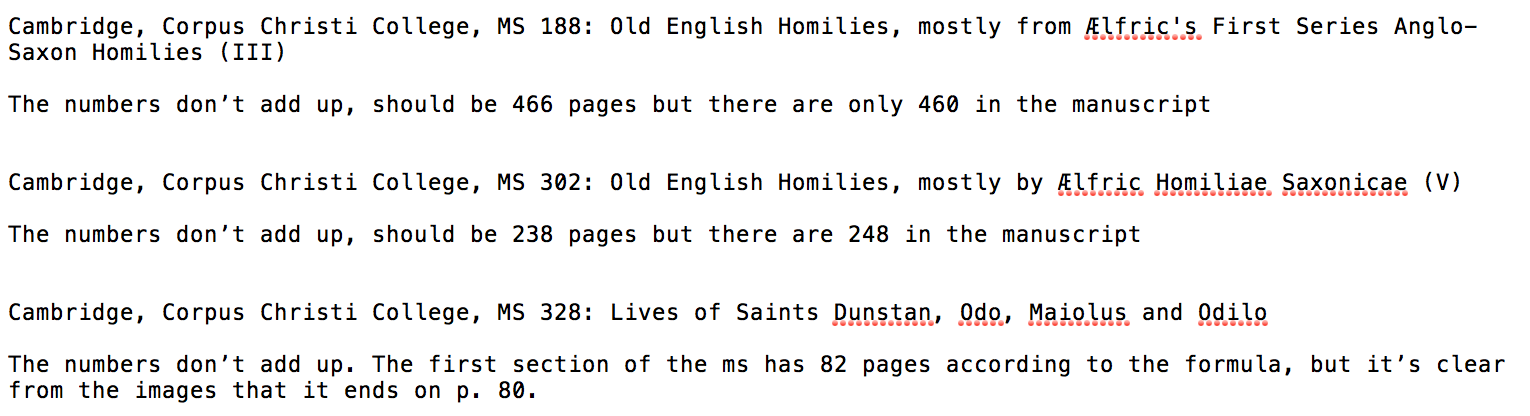
I have a list of manuscripts that I was unable to make models for because of slight variations between numbers of leaves needed by the model and the number of pages or folios listed in the description. Somebody would need to sit down with the manuscripts to see if the problem is with the formula or the foliation or pagination. (This shows one of the positive side effects of the collation modeling approach that I didn’t consider when we started, it can be used as a tool in the catalogers toolkit to double-check both the collation and numbering to ensure they align).
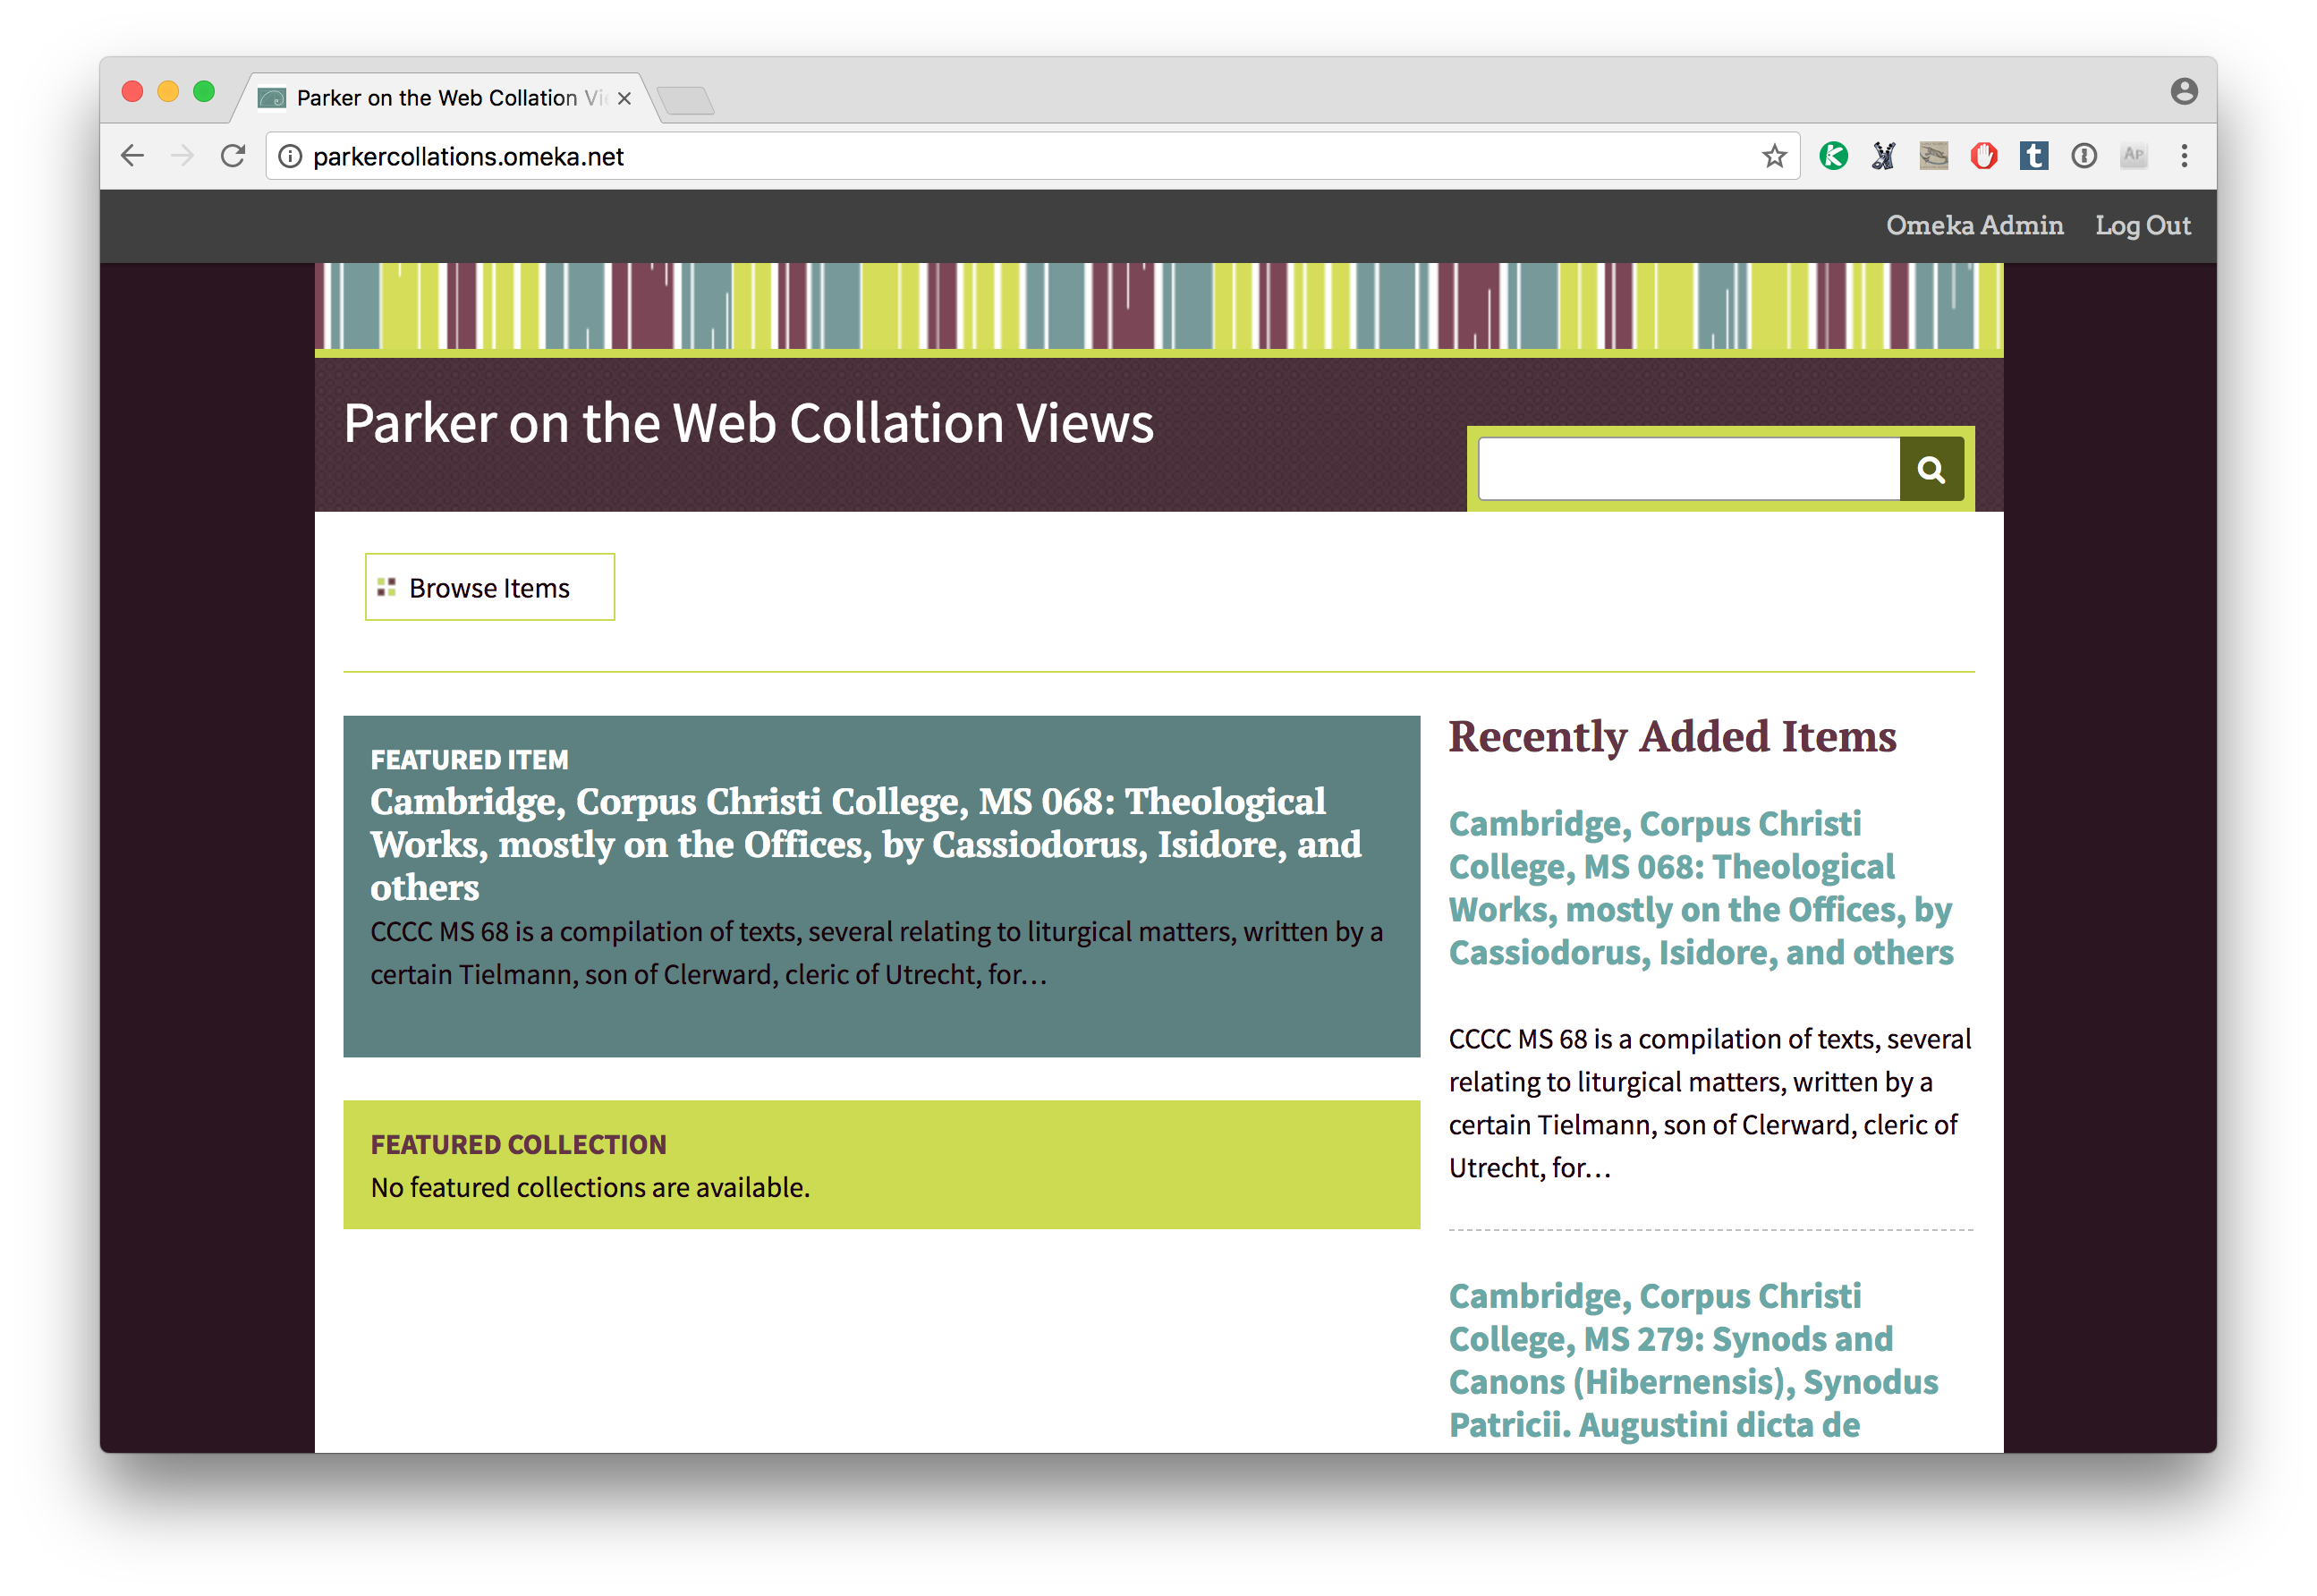
I’ve created a website that links brief records to the Parker on the Web and the diagram/bifolia collation views, just for fun (and I’m afraid it’s not very pretty). But if you’d like to see that you can visit parkercollations.omeka.net. [no longer online]
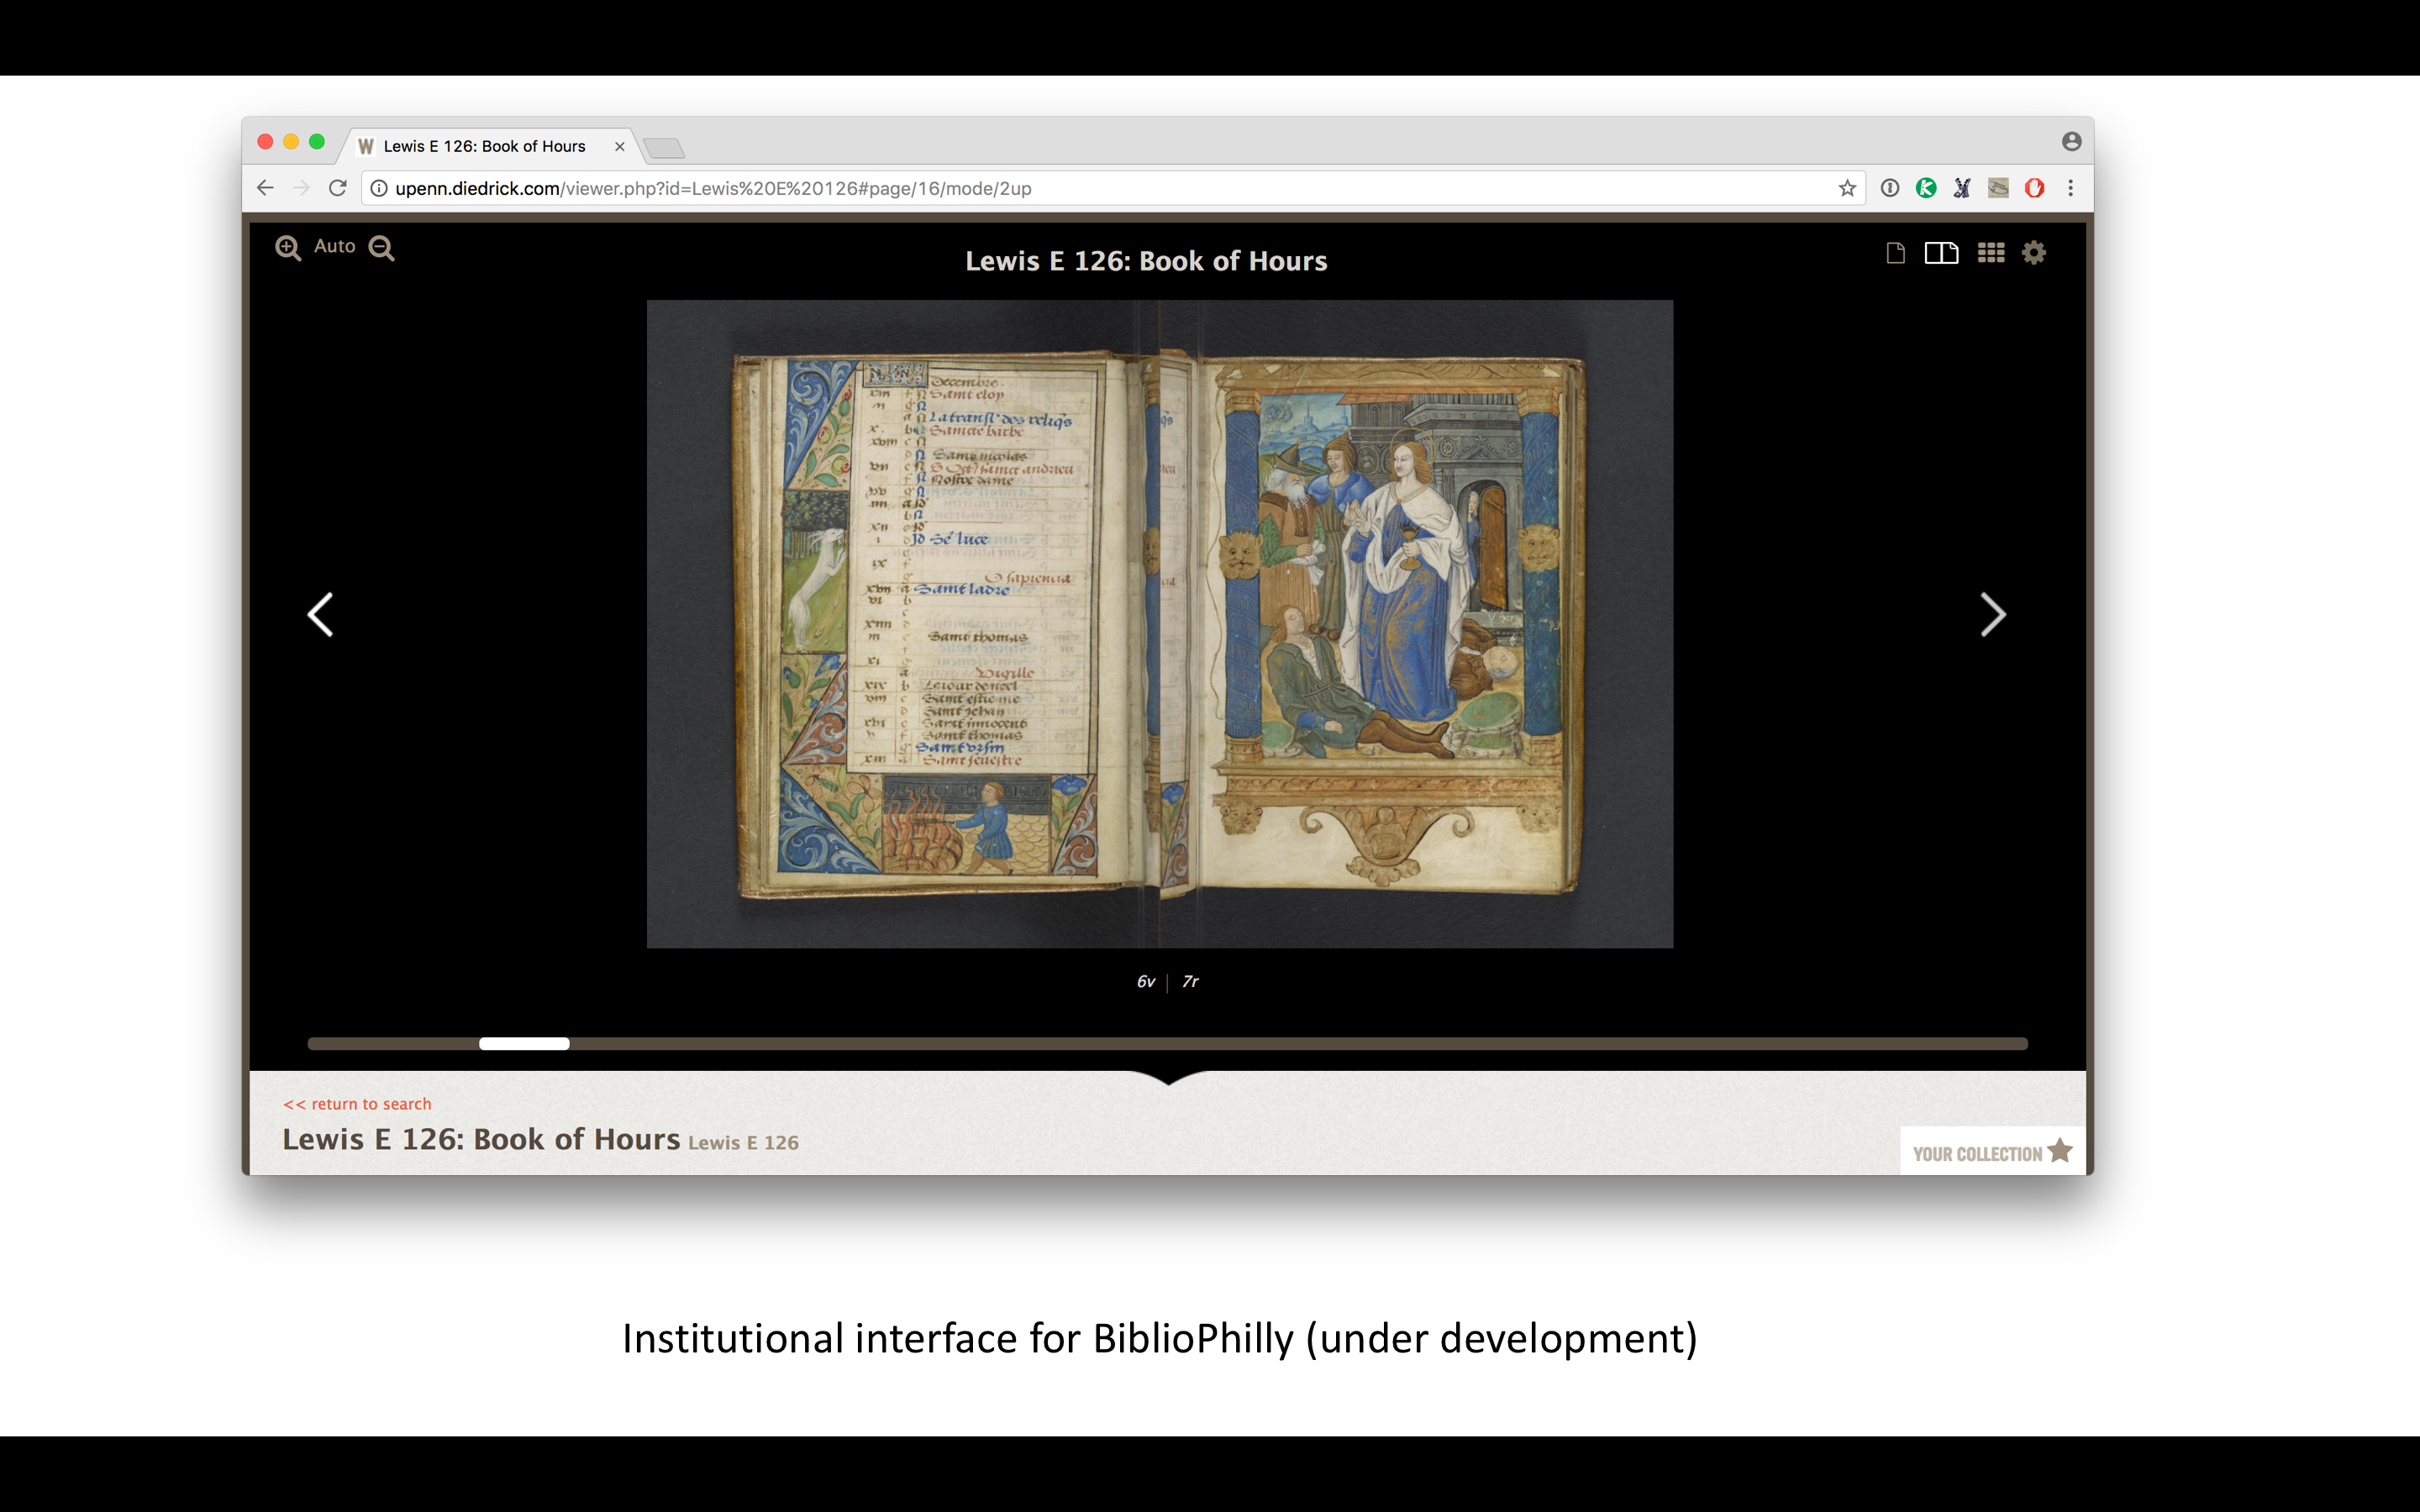
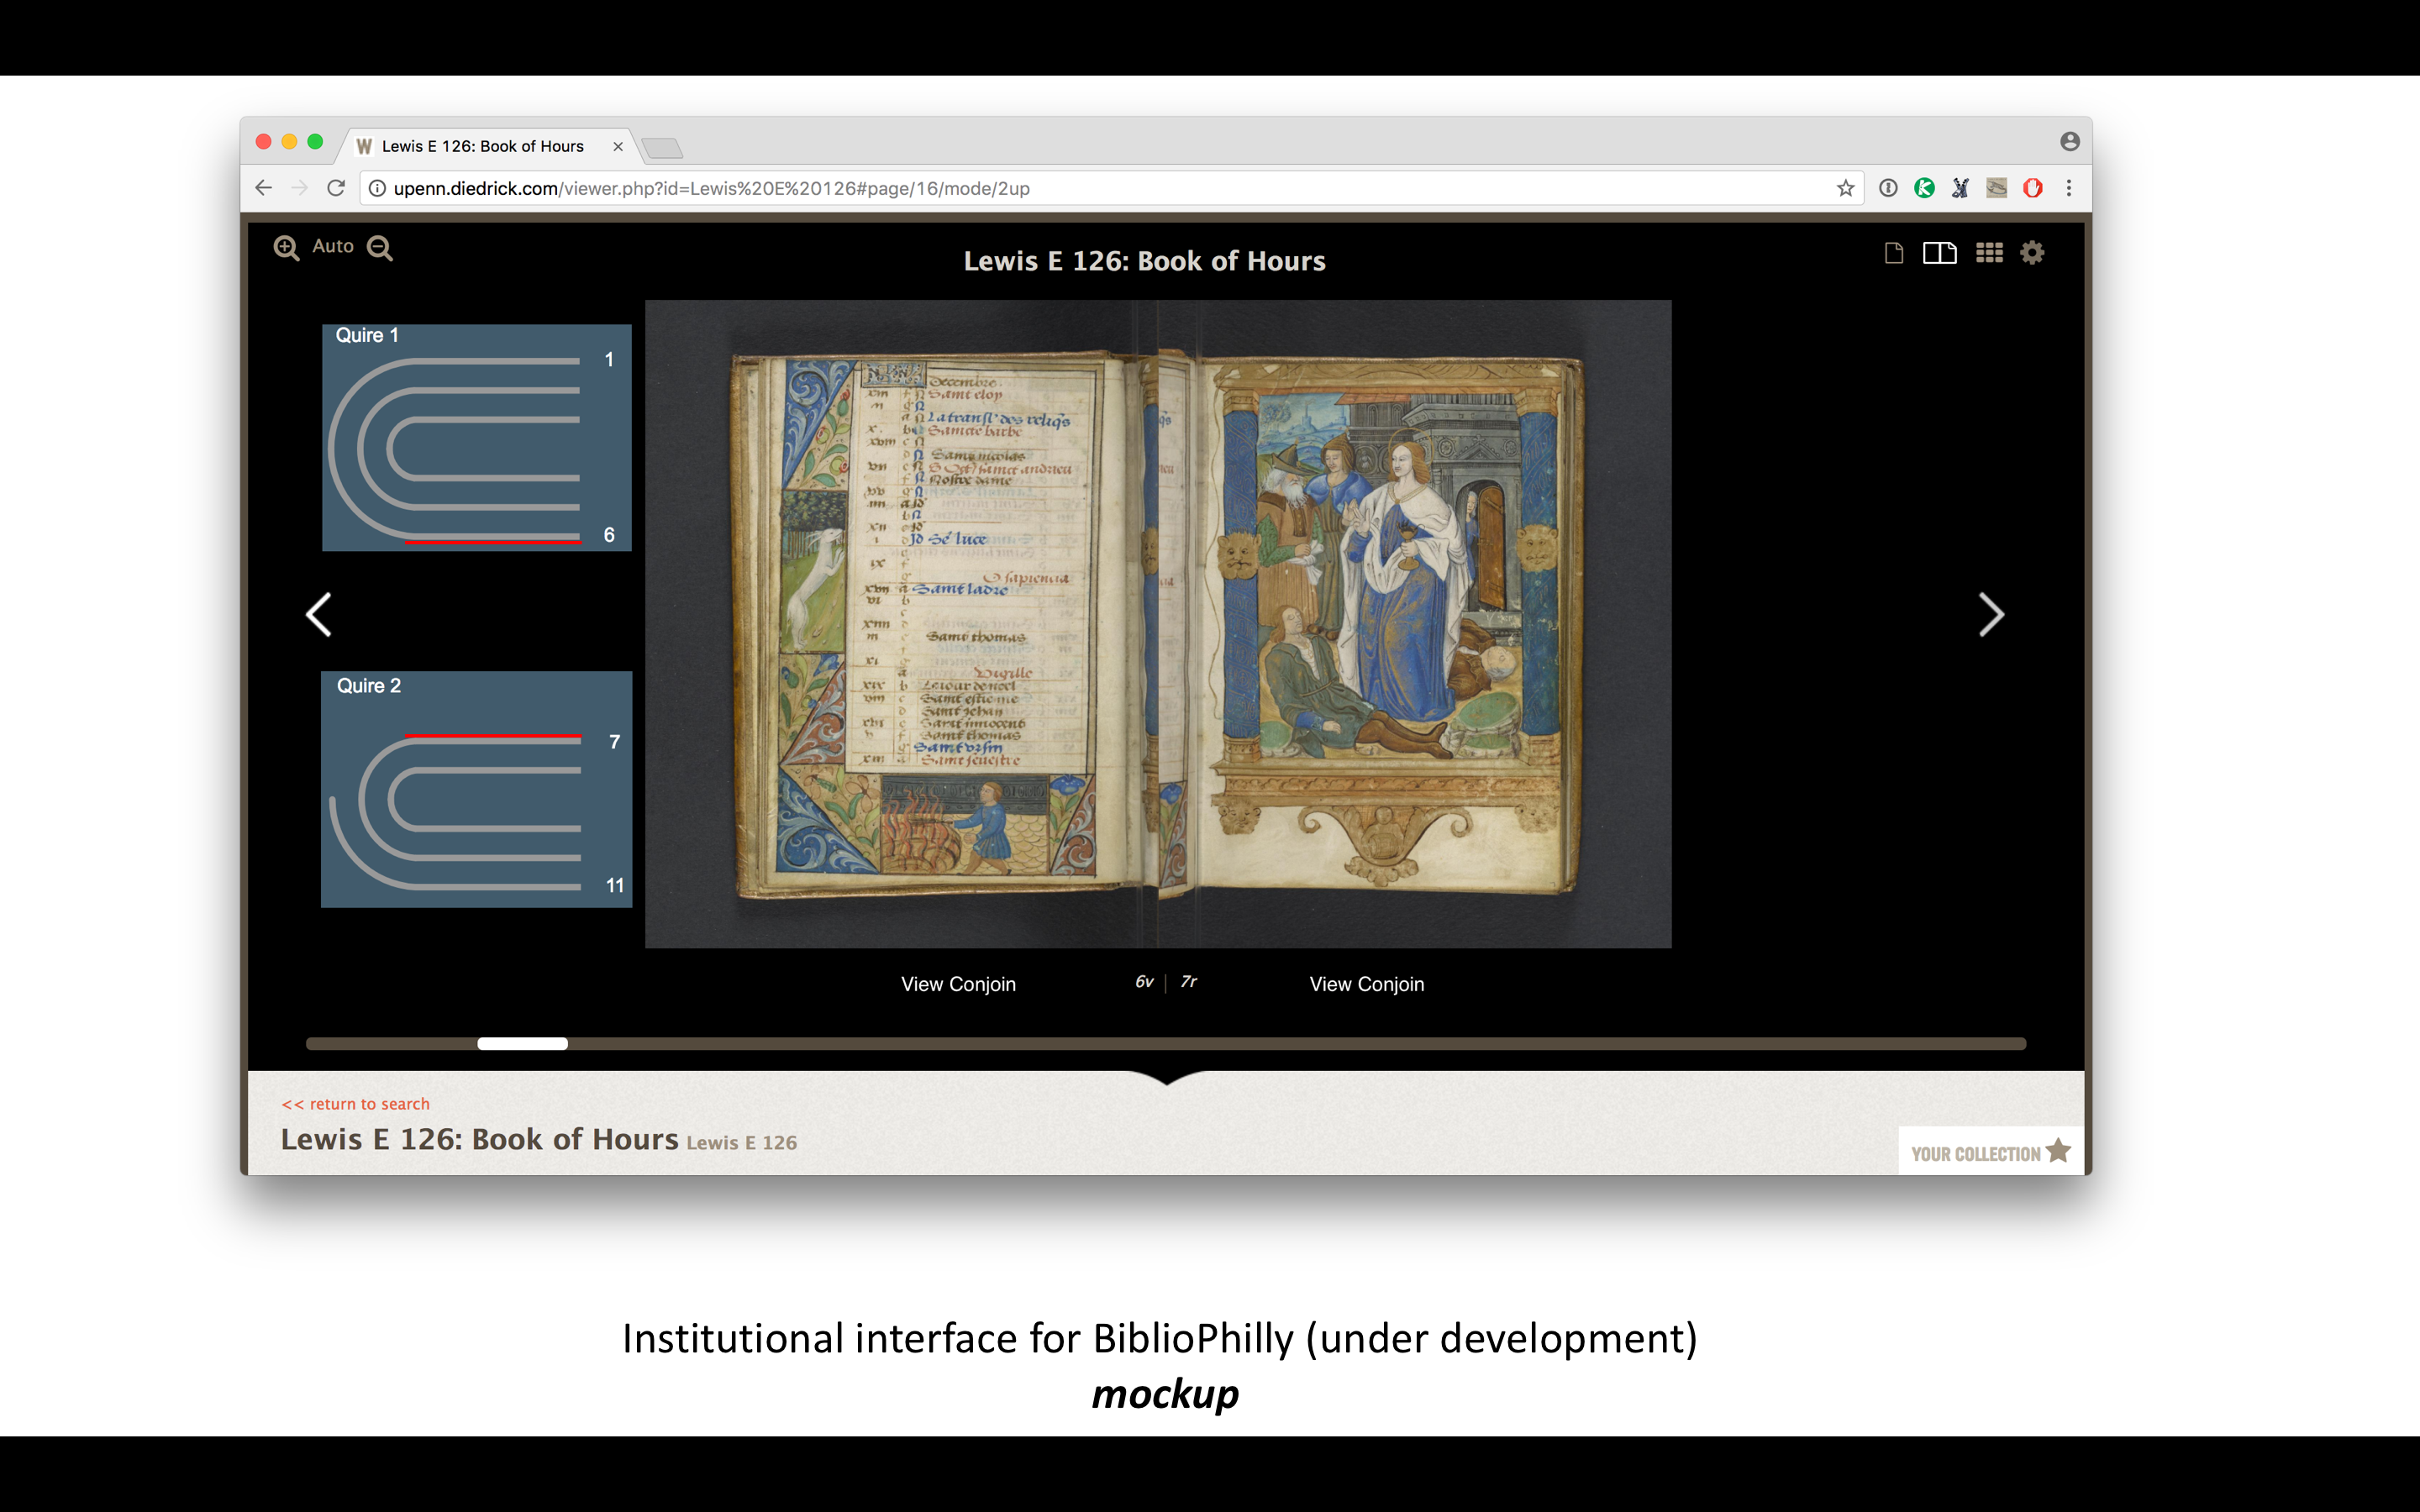
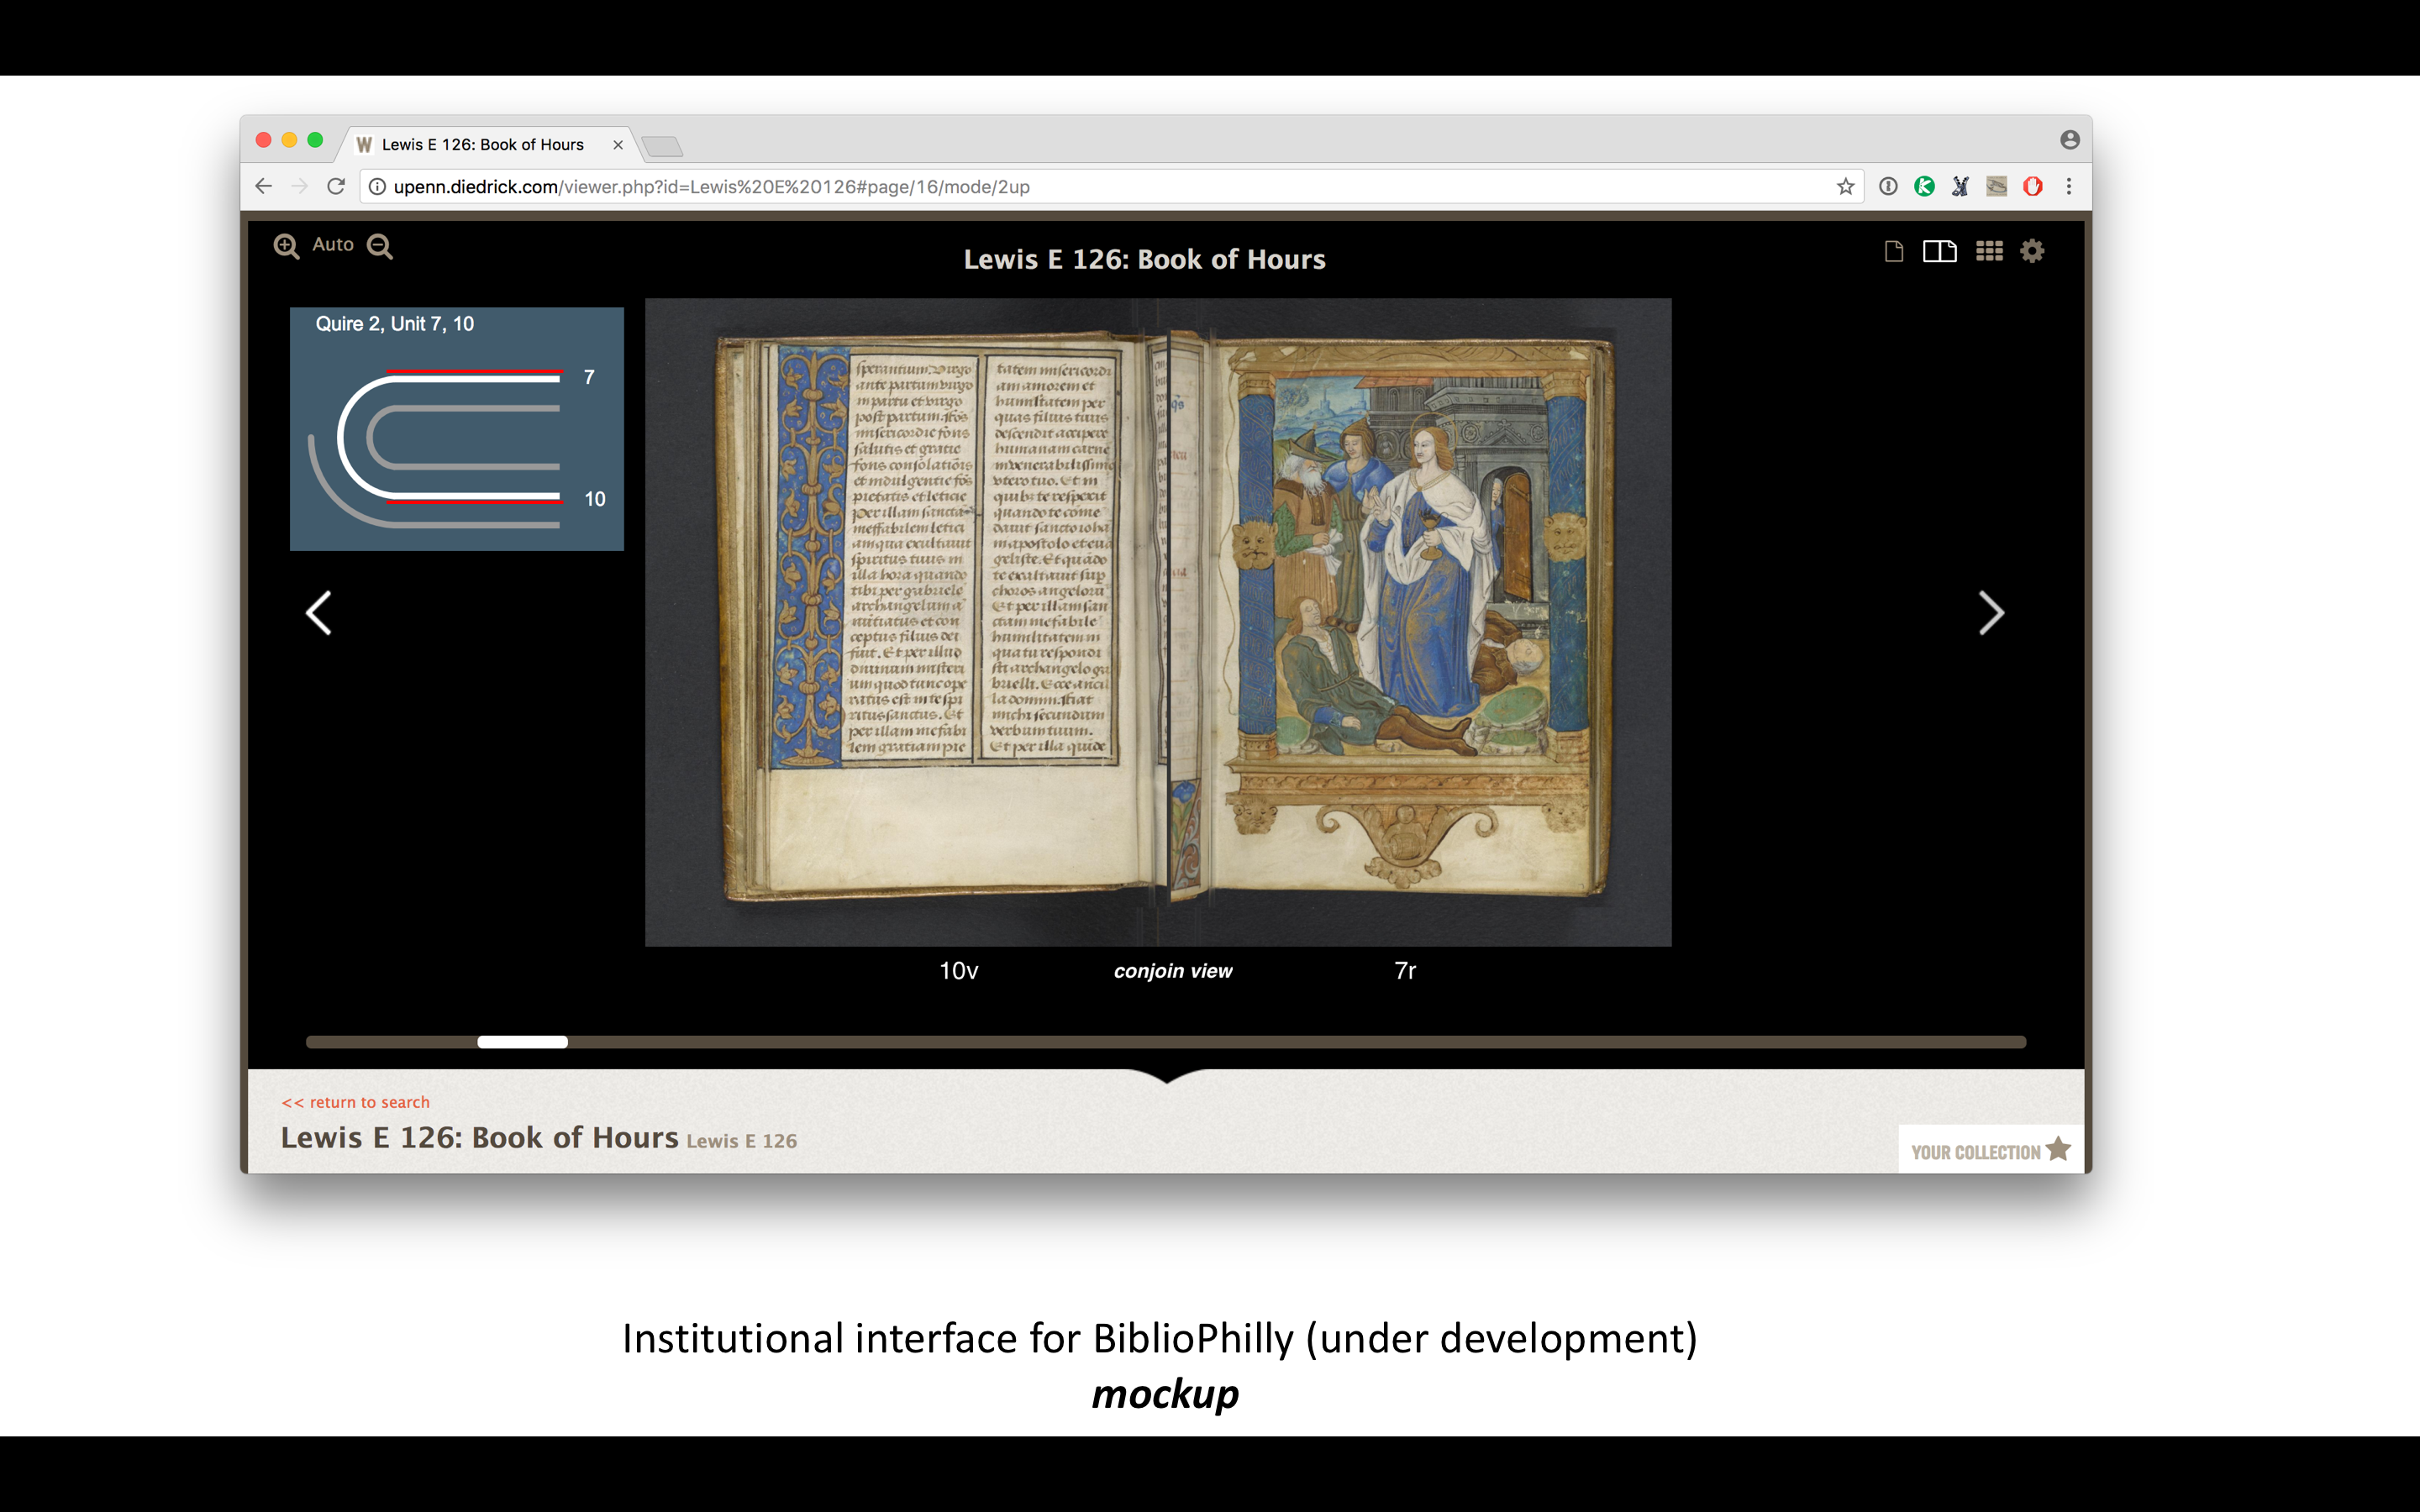
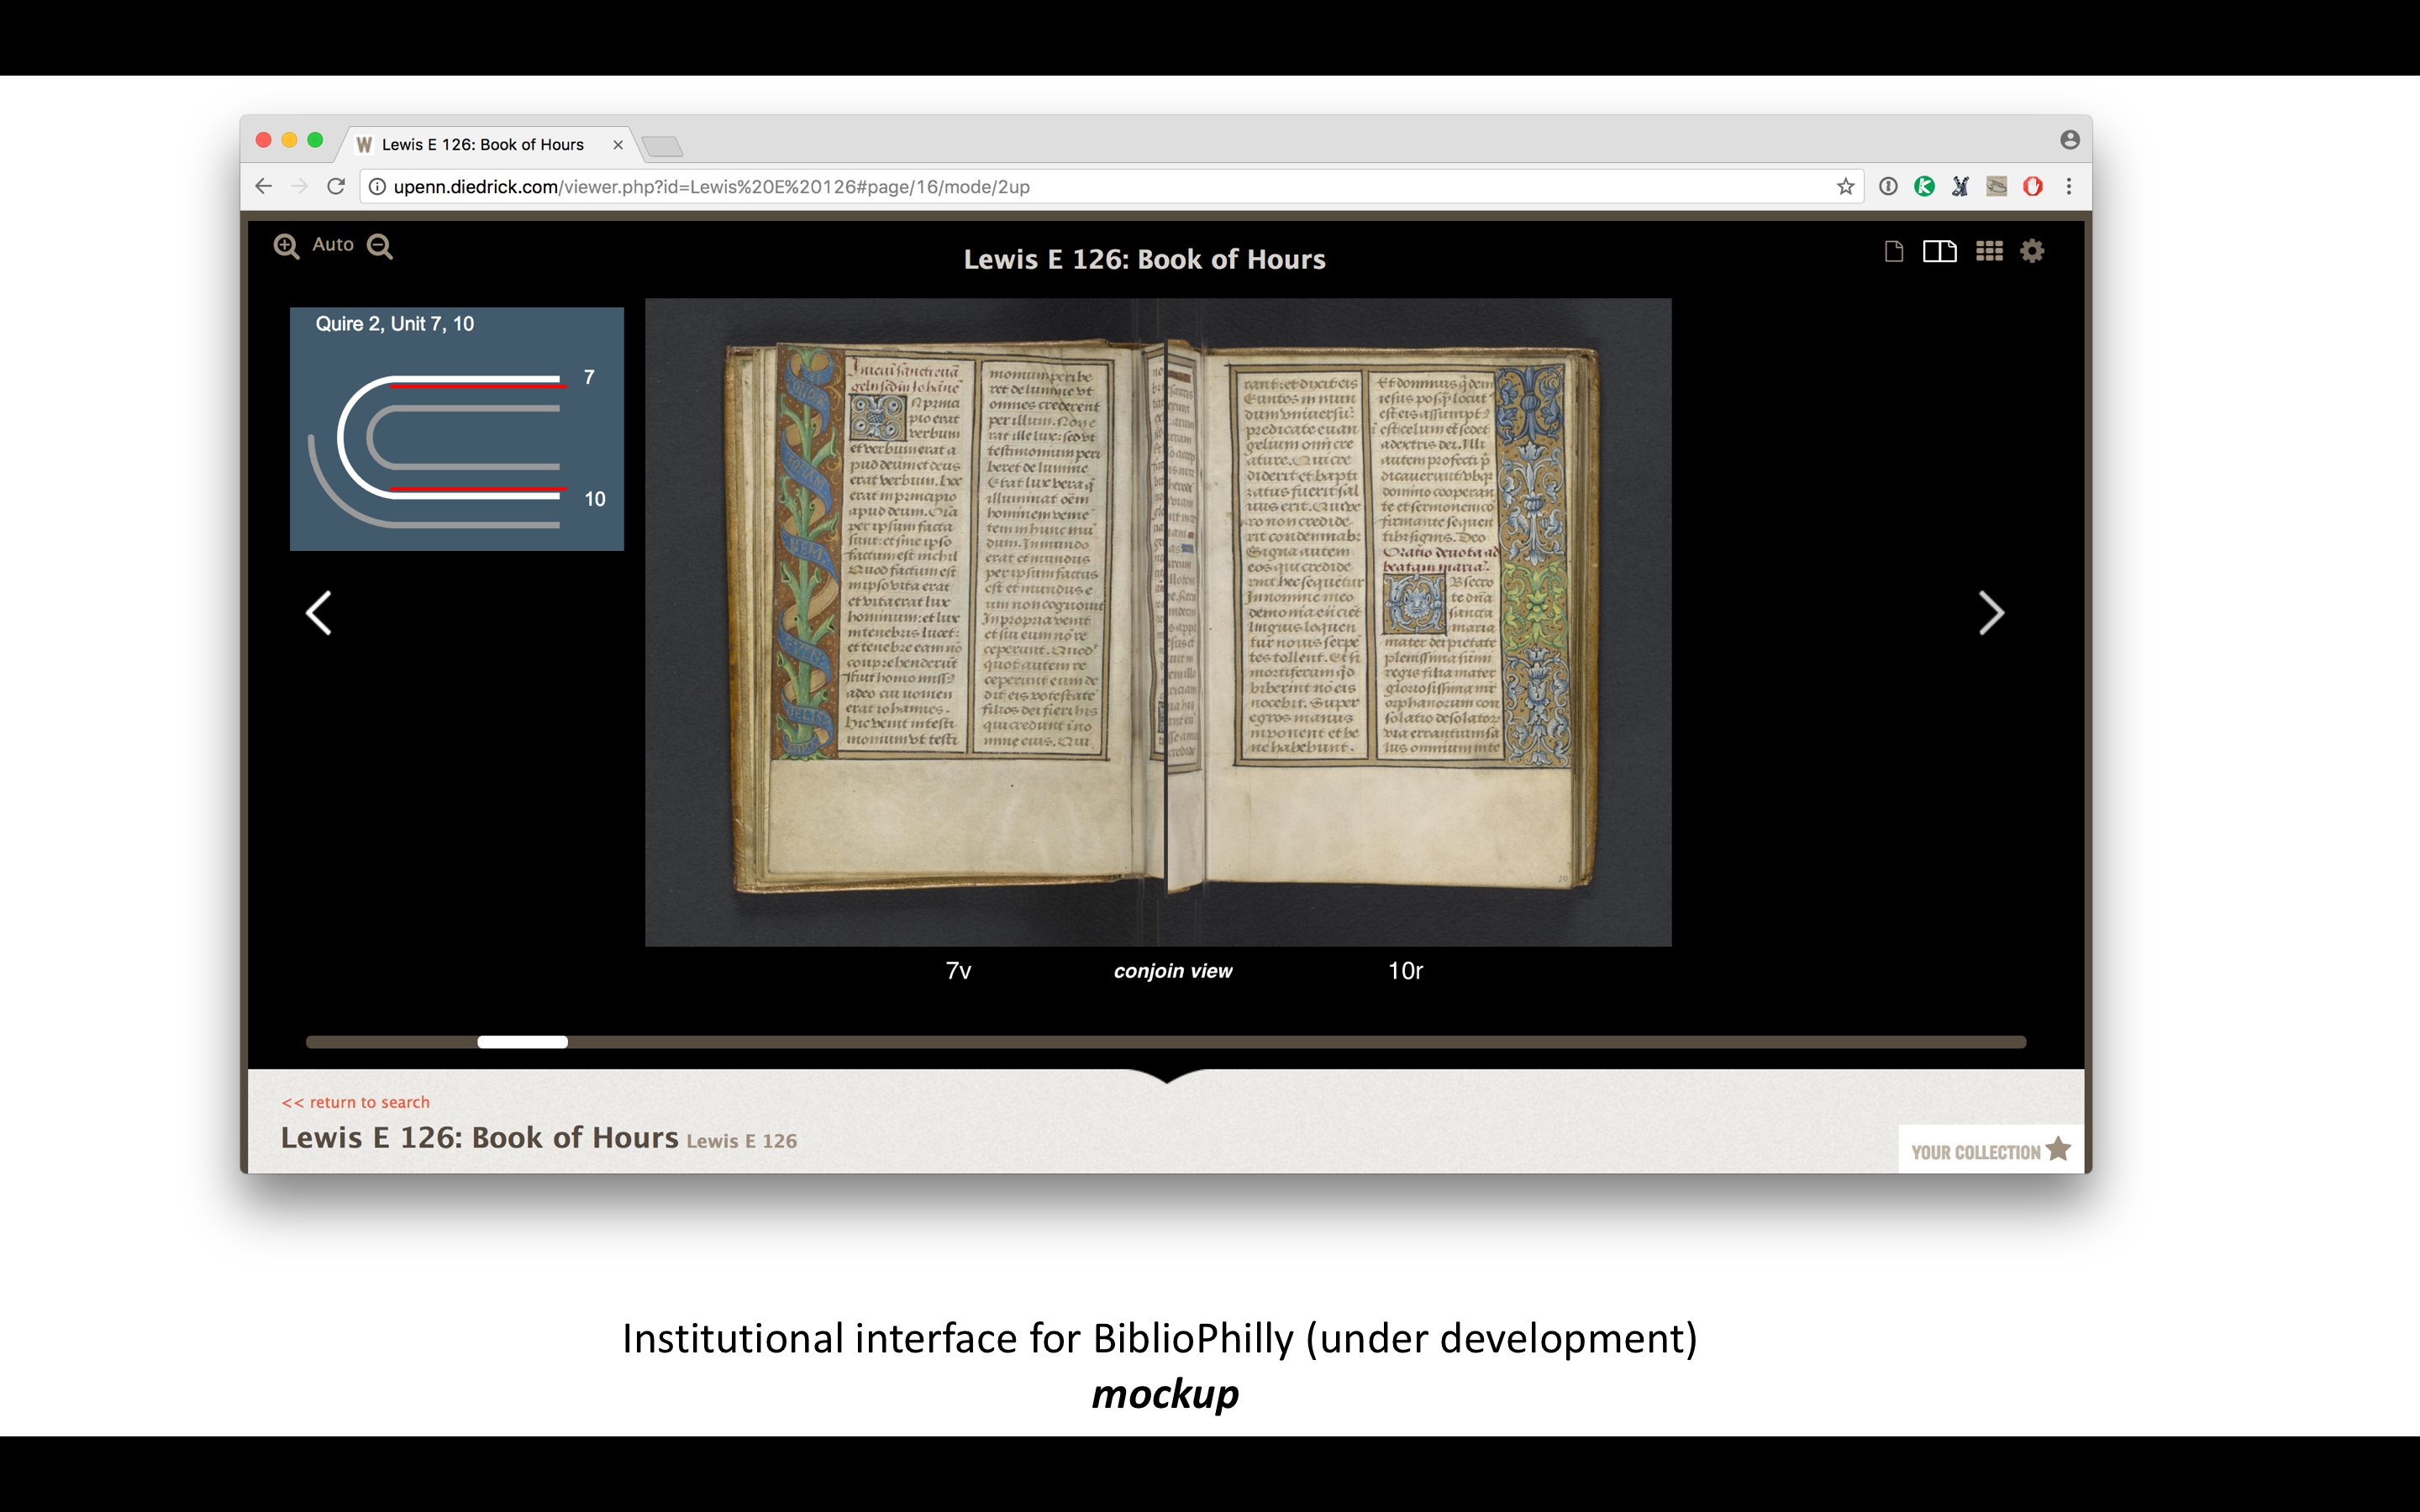
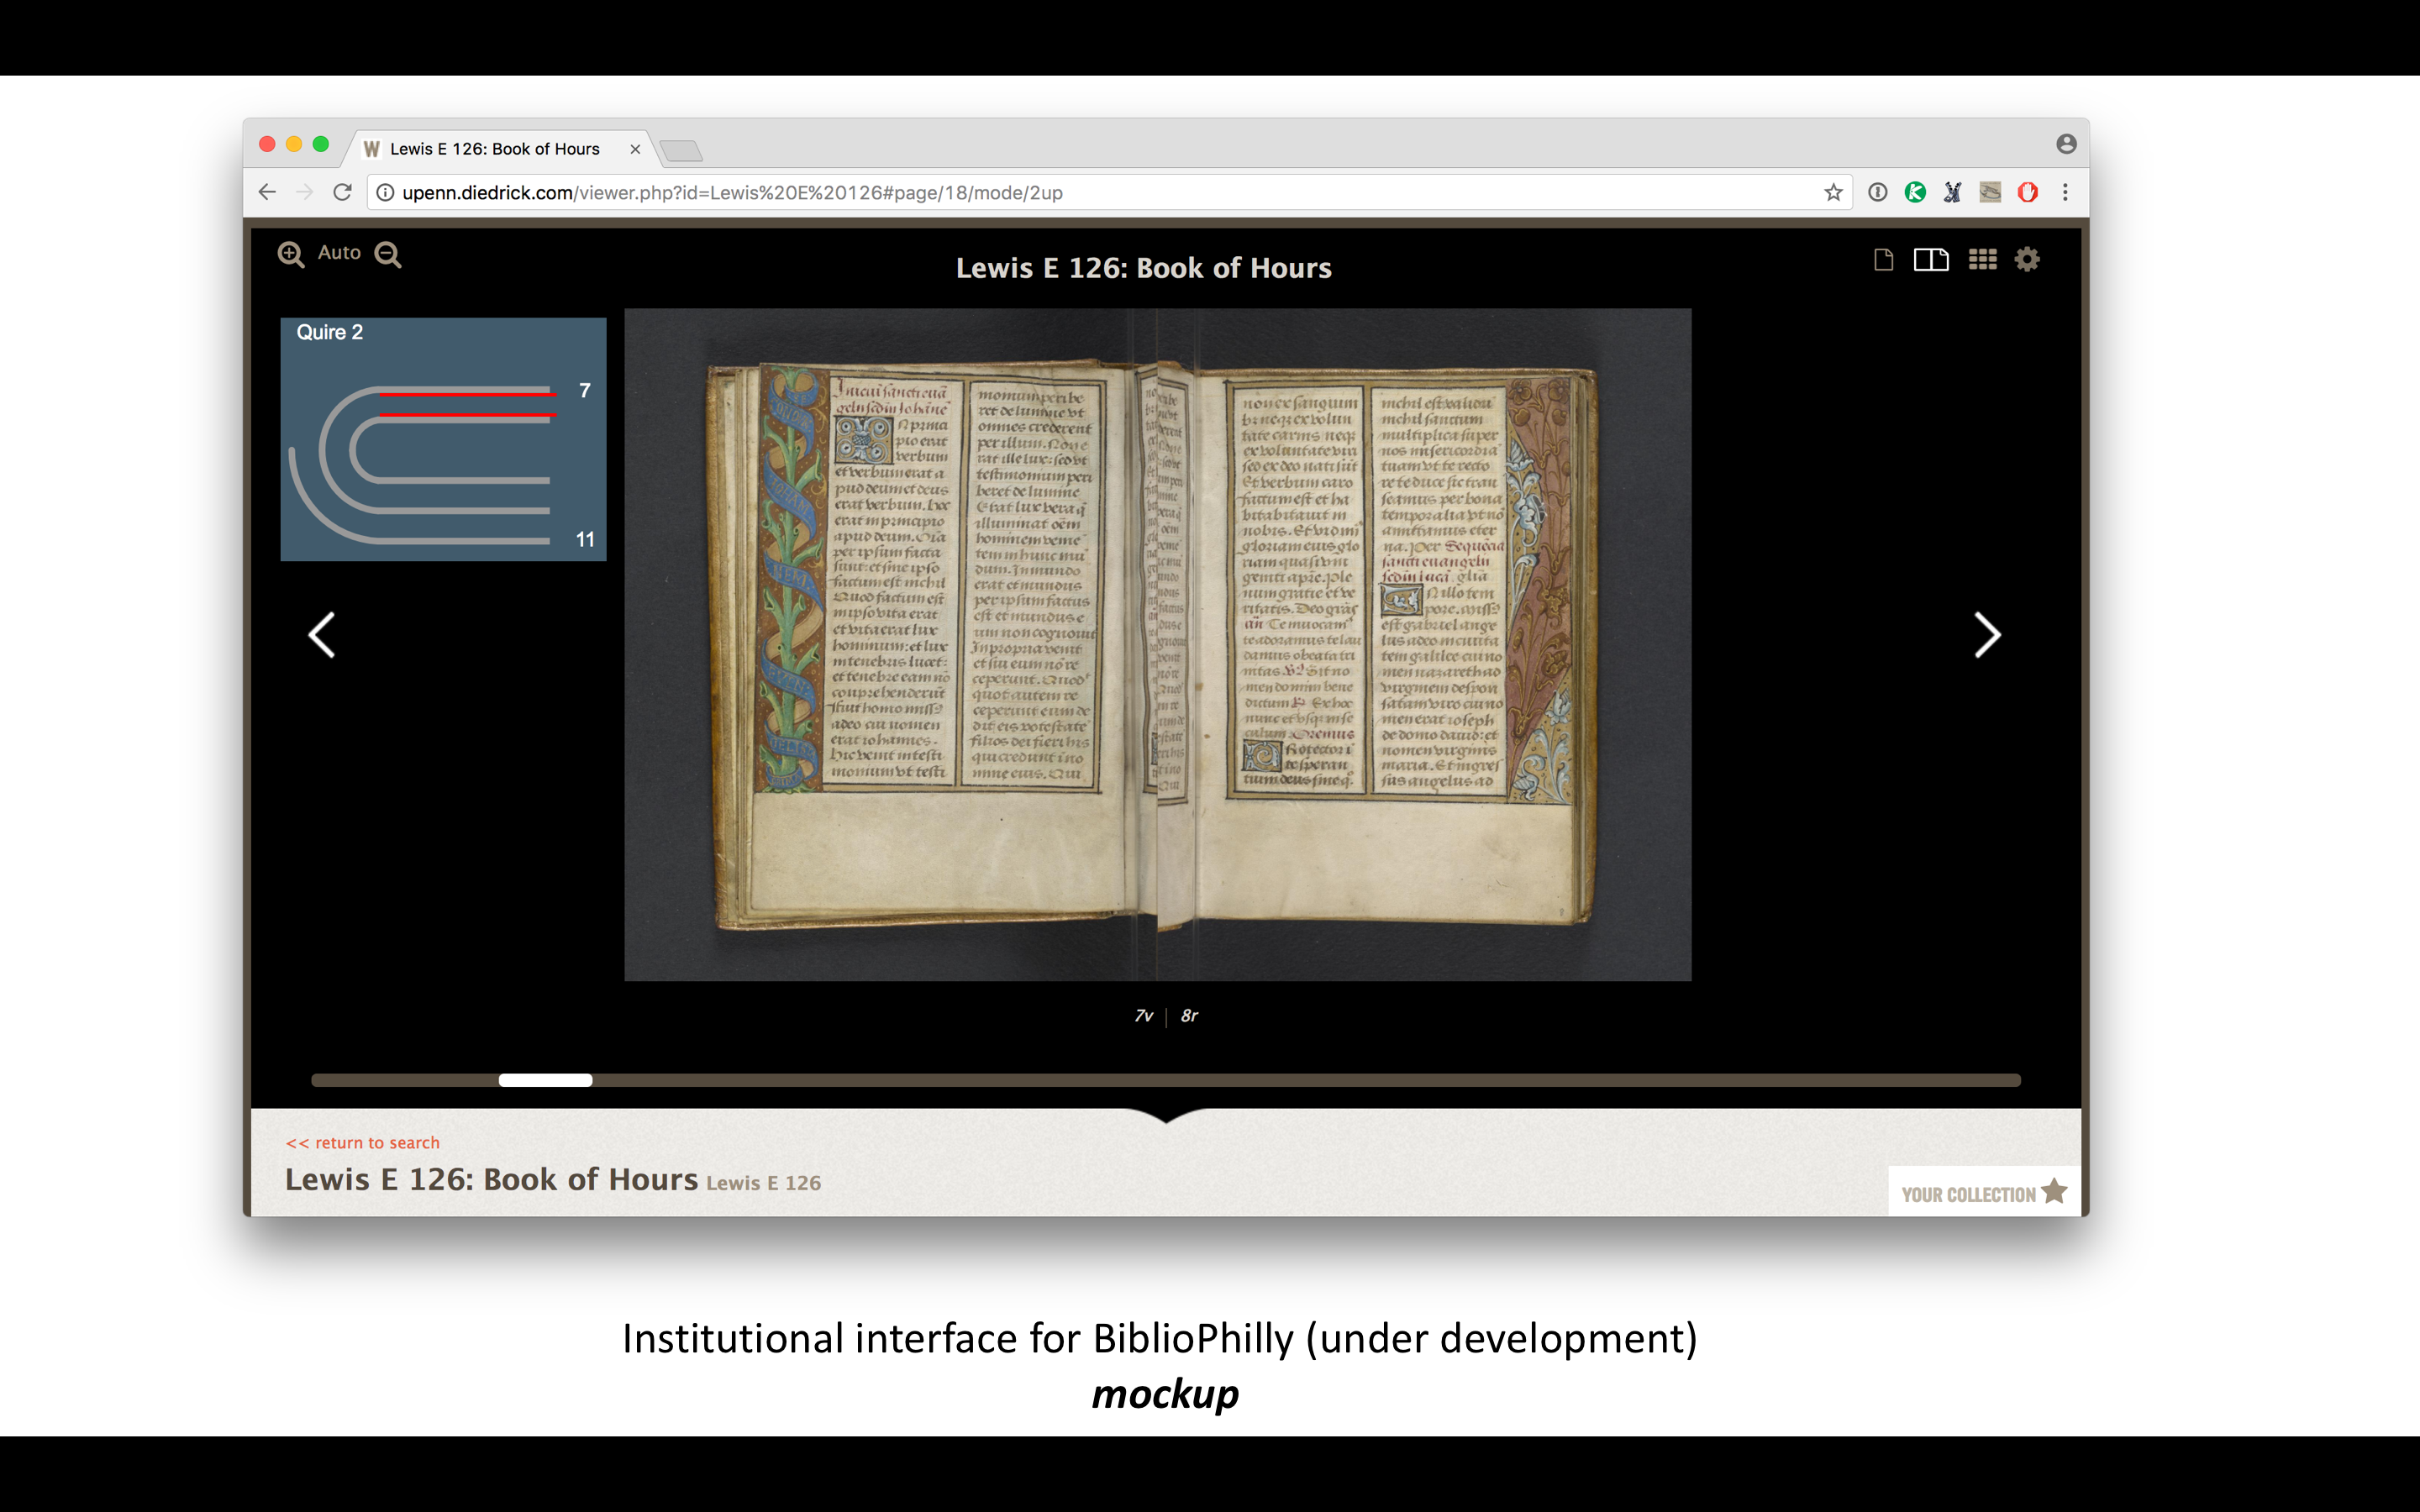
Although the combined diagram/bifolia view is interesting on its own, I’m most interested in how it might be combined with the more traditional facing-page view to provide an alternative access/navigation to digitized manuscripts. I’m currently co-PI on Bibliotheca Philadelphiensis (BiblioPhilly), a collaboration between the University of Pennsylvania, the Free Library of Philadelphia, Lehigh University, and the Philadelphia Area Consortium of Special Collections Libraries (PACSCL) and funded by the Council on Library and Information Resources. BiblioPhilly serves to digitize all the medieval manuscripts in Philadelphia written in Europe before 1600 (476 of them, not including several hundred already digitized at Penn). We have incorporated collation modeling into our cataloging workflow, and we are working with a software developer to build an interface that will make the collation information an integral part of the experience.
Here are some mock-ups that I made to pass along to the software developers so they can see what I’m thinking about, but there will be a certain amount of back and forth with them, and others in the project are involved in this, so I’m not really sure what we’ll come up with but I’m excited to see it. And the reason we can do this is because we have the data. Now we can build the processes.
There’s no reason not to incorporate collation views of some kind into the navigation options of the Parker on the Web and other IIIF collections. There would need to be a standard way to model the collation within IIIF manifests, and then add a plug-in to the IIIF image viewers that takes advantage of that new data in new and interesting ways.
I hope that our experience with integrating VisColl into BiblioPhilly from the beginning, and my experiments building models from the Parker formulas for this talk, will encourage Parker on the Web and other libraries to develop more experimental interfaces for their digitized manuscripts.
Addendum
During his presentation “The Durham Library Recreated project,” Dr. Richard Higgins from Durham University Library suggested using the Bodleian Library’s Manifest Editor, one tool in their Digital Manuscripts Toolkit, to rearrange images so they present as bifolia in the facing-page view. Here is a screenshot of the manifest for MS 433 with the first quire rearranged as bifolia:
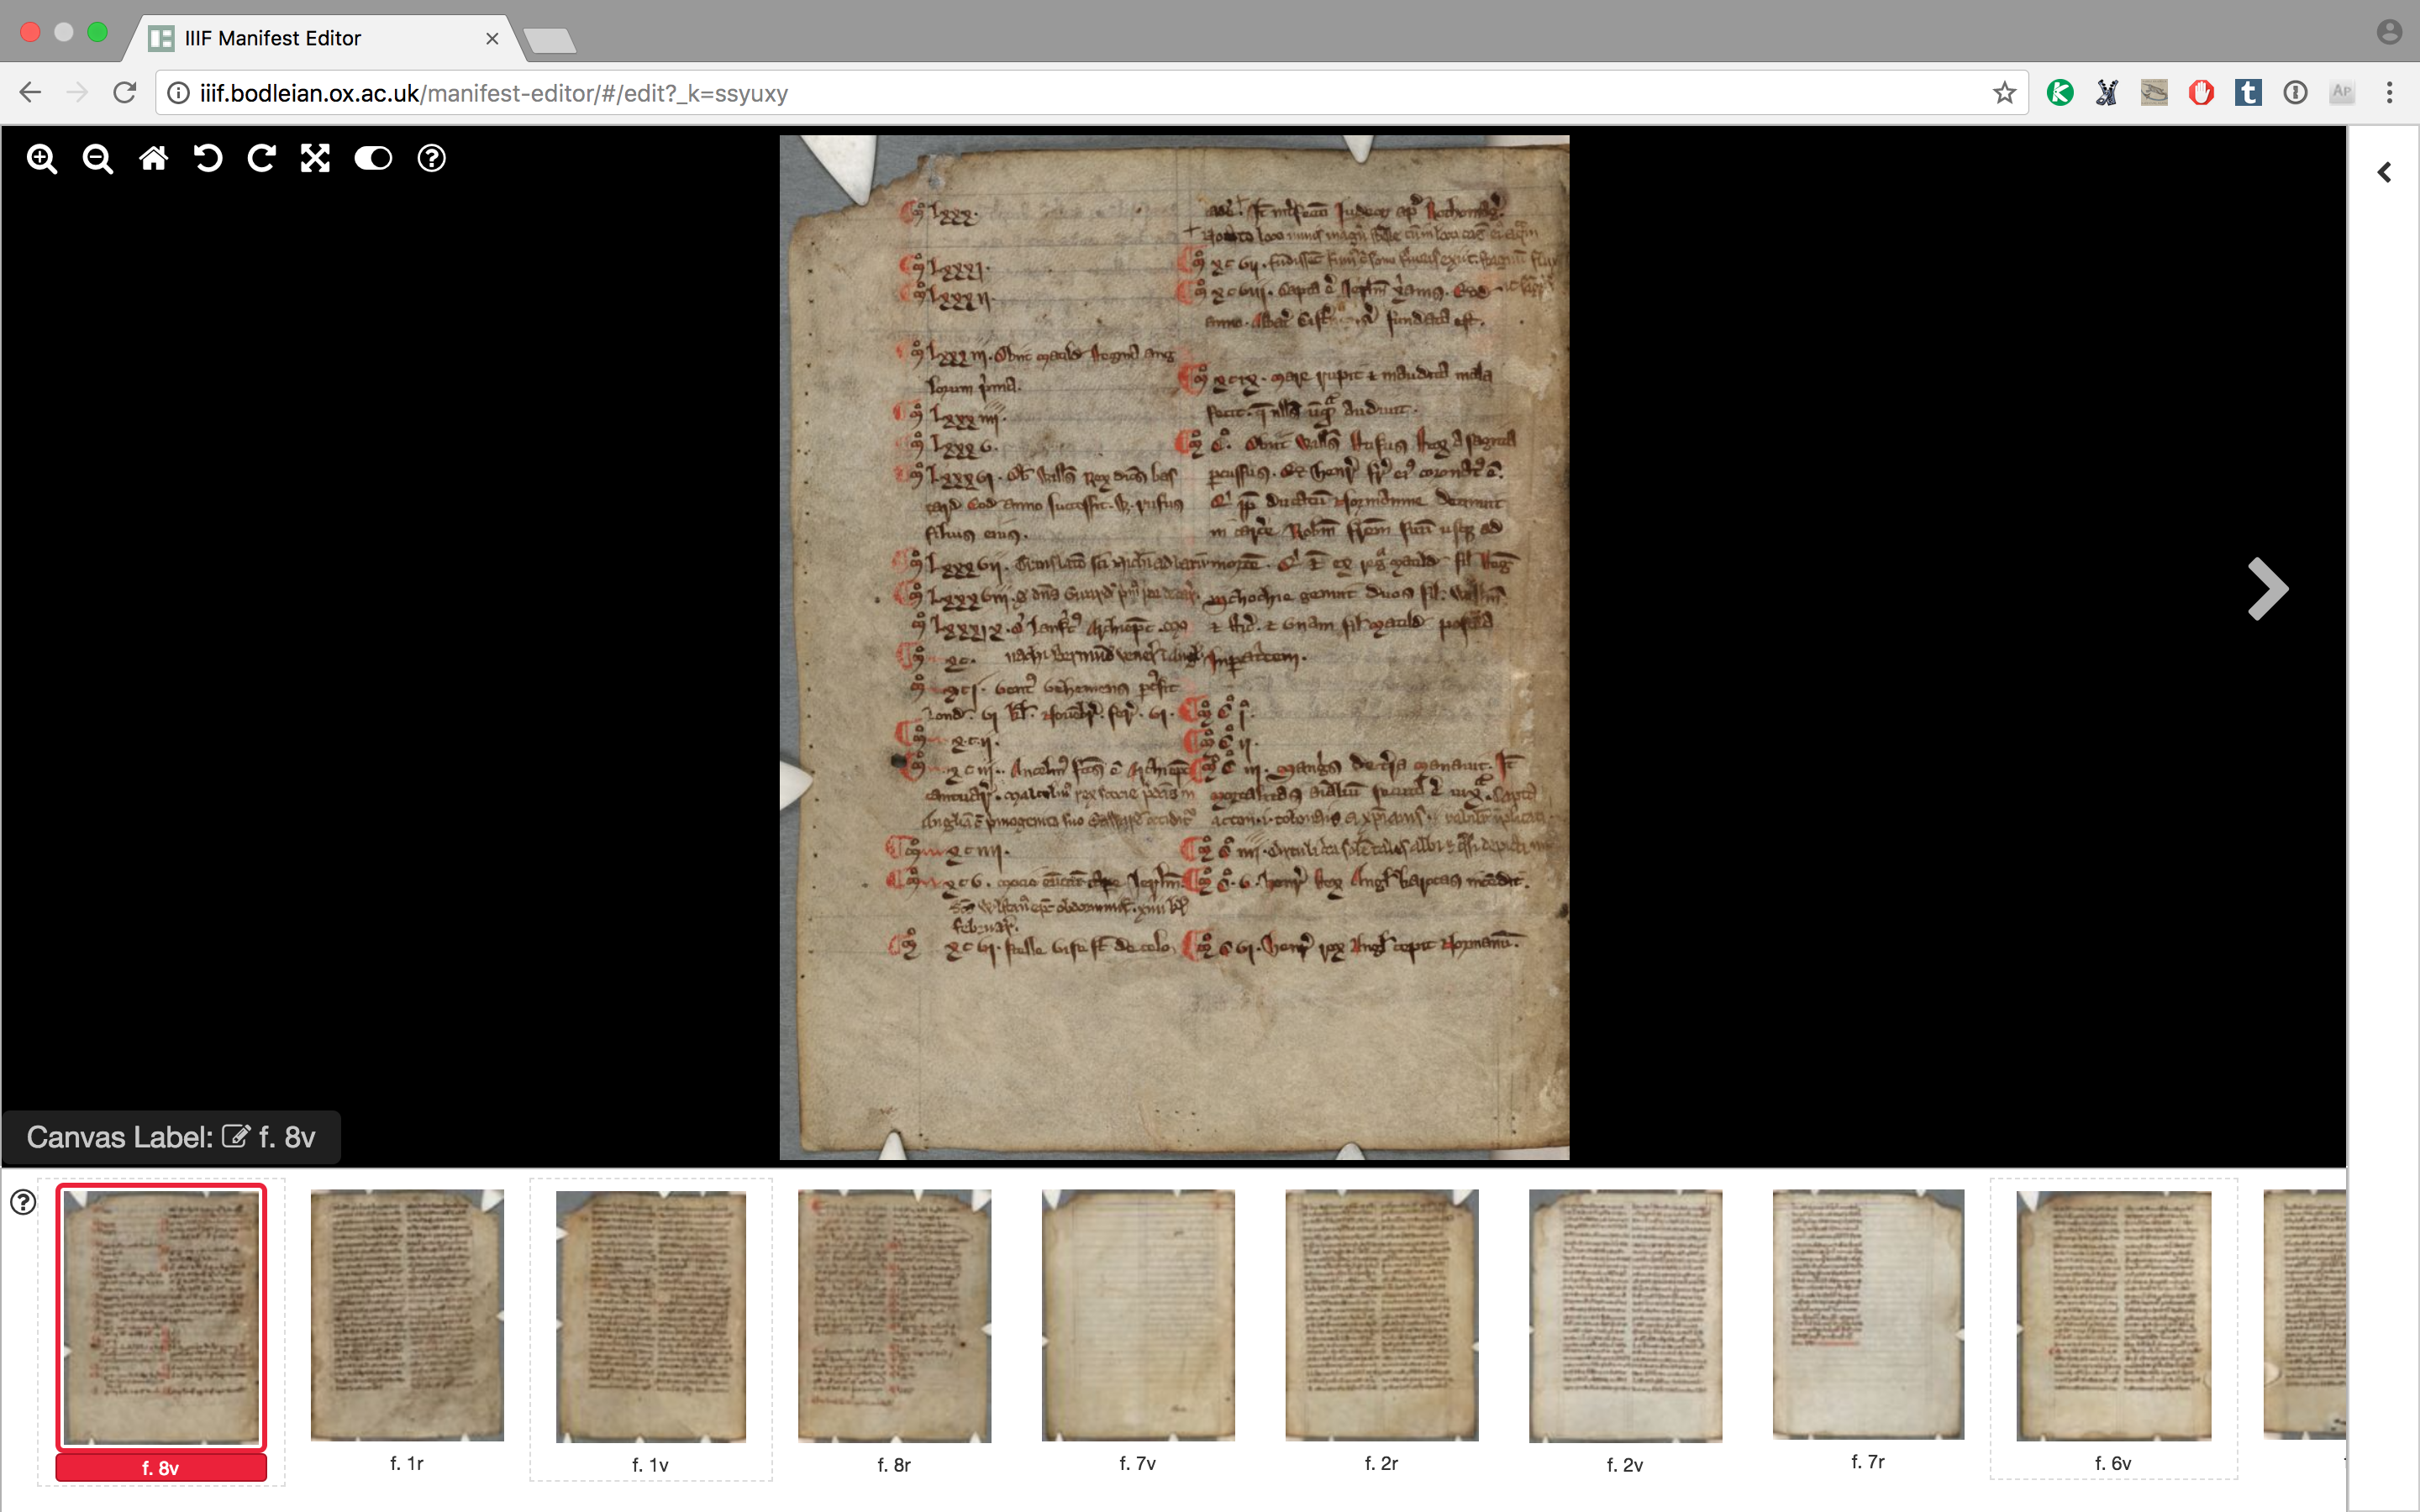
This works on one level: if you paged through this in an interface using a Book View, you would be presented with the conjoin leaves as sheets. But it’s really just another flat list of images, presented one after the other, just in a different order than they are in the book (Edit on 3/20/2018: It’s come to my attention that this is the general approach used by the Electronic Beowulf 4.0, in that edition’s collation navigation, so if you want to try paging through manuscript images organized by bifolia you can do it there. Instructions are here; be sure to select manuscript for both sides or else it’s not possible to click the collation option). This approach doesn’t really express the structural, three-dimensional aspect of the manuscript’s collation, so it can’t be used to generate alternative views (like diagrams or formulas). I think that a manifest like this could, however, be another kind of output from a collation model, but I think for IIIF it would make more sense to make the model part of the manifest, or something standard that IIIF APIs combine with manifests, to create any number of collation-aware views.